Market Update – September 1
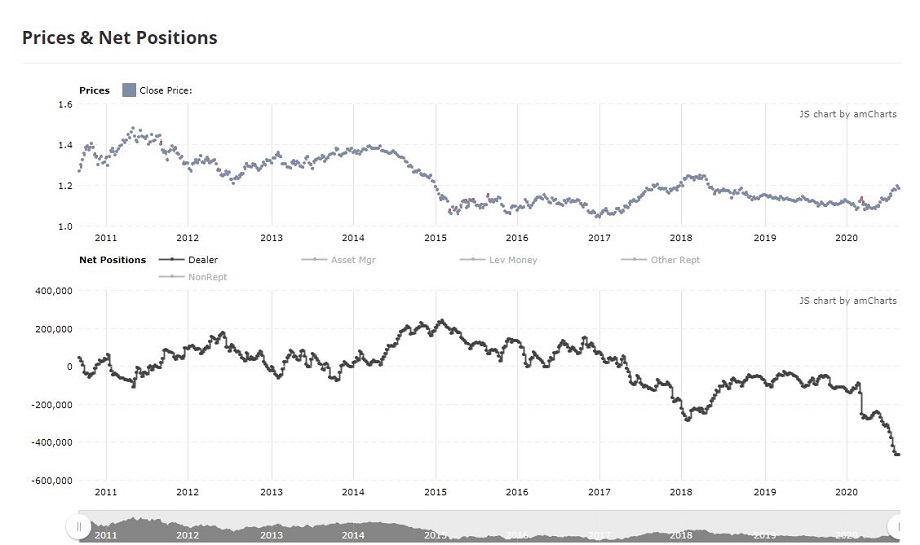
EURO FUTURES DEALER NET POSITION
In financial futures, dealers are considered the ‘smart money’. They tend to be bearish at the top and bullish at the bottom. So, it usually pays to pay attention when their position becomes extreme. Well, the dealer short position in Euro is basically off of the bottom of the screen. In fact, the dealer short position in early 2018 (last big EURUSD high) pales in comparison to the current position. Price wise, pay attention to the levels noted yesterday.
8/30 – EURUSD high on Friday is on the center line of the channel from the 5/14 low so a turn lower now wouldn’t surprise. My trading focus is on shorting a break under the lower parallel, currently about 1.1730. If price makes a new high, then pay attention to 1.2000/50, which is the median line of the fork from the 2015 low (not yet confirmed) and line off of the 2008 and 2014 highs.
US DOLLAR INDEX FUTURES DEALER NET POSITION

USD futures dealers are net long for the first time since the early 2018 low. As this chart illustrates, long positions over the last decade have occurred at/near price lows in DXY.
8/30 – Is DXY still ‘trying’ to bottom? If so, then it needs to turn up around 92, which is the line off of the 2011 and 2014 lows (arithmetic scale). 91.50-92.00 has also been a major pivot since 1998. I sound like the boy who cried wolf but I’m on alert for a turn higher.
SPY DAILY

Pay attention to the line off of the January 2018 and February 2020 highs in SPY near 355 (1.6% higher from today’s close). Interestingly, the line extended to the left crosses the August 2008 high (lower high within that bear market), January and March 2008 lows, and lows in 2002 and 2003. On a closing basis, the 2002 and 2003 lows are right at the line. Bottom line, this line/angle has proved influential for nearly 20 years. Longer term charts are below.
SPY WEEKLY

AUDUSD DAILY

AUDUSD poked above the December 2018 high today at .7394 and pulled back slightly. Generally speaking, .7400-.7500 was an important zone from 2017-2018 so it could be important again. Near term, price is pressing the top of the short term channel (see below). Below .7300 (center line within the short term channel) is needed in order to suggest that price is reversing lower. RBA is tonight.
AUDUSD 4 HOUR

AUDJPY WEEKLY

AUDJPY is nearing the line that connects the 2014, 2017, and 2018 highs. The line is about 78.80. If price overshoots, then be aware of the 200 week average at 79.90. Notice the myriad major turns off of the 200 week average over the last 20+ years!
NZDJPY DAILY

NZDJPY has entered a well-defined resistance zone. The bottom of the zone is defined by a parallel (magenta line) from the 2015-2017 line and the underside of the line off of the March and May lows (red line). The top of the zone is defined by highs in July and December 2019 and the noted 2015-2017 line at 73.25. I am looking for price to turn lower and will alert if near term price action presents an opportunity for entry.


