Market Update – August 6
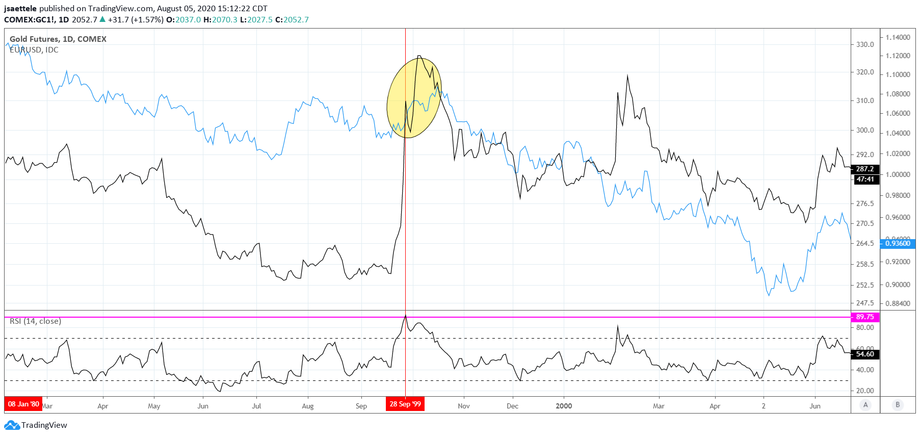
Expanding on yesterday’s gold chart (remember that the Fibonacci measurement is 2095…today’s high was 2070…), daily RSI is now 89.8. The indicator has been this high just twice before; January 1980 (twice) and September 1999. I’ve overlaid EURUSD for both periods. In 1999 (above), gold spiked higher after pulling back from the extreme RSI reading and eventually topped on October 5th. EURUSD didn’t top until October 15th but then dropped for the next year. In 1980, EURUSD topped on the exact day of the extreme RSI reading (January 7th…see below) and plunged for the next 5 years. Gold pulled back slightly before spiking into its high on January 21st. This says nothing of what will happen going forward with either gold or EURUSD. Rather, historical precedence does suggest that both are vulnerable to mean reversion and possibly much bigger trend reversals.
GOLD AND EURUSD (BLUE) DAILY (1980 GOLD RSI EXTREME)

GOLD ANALOG DAILY

This is a gold analog I’ve been following since December 20th. The queried time series is in red. Since then, gold has followed the projected path fairly well. The next pivot in the analog is August 12th (next Wednesday). Worth following as long as this is ‘working’. A zoomed out full version is below. Let your mind get creative.
GOLD ANALOG DAILY (ZOOMED OUT)

AUDUSD WEEKLY
Over the last 20+ years, AUDUSD trends have confined to well-defined channels. As shown several times over the last week, price is currently testing the upper boundary of the bearish channel from the 2011 high. The 200 week average is currently .7257. Today’s high is .7241. The technical situation is similar to June 2002 (circled), when AUDUSD pulled back sharply from the channel / moving average combo. That pullback was the first correction within a long term bull. I’m of the mind that something similar occurs now (sharp pullback to reset sentiment for a much larger move higher). Price continues to respect the short term channel (see short term chart below) so today may have been the high. Consider too that NZDUSD didn’t make a new high with AUDUSD (non-confirmation). If price drops under the center line from this channel then pay attention to the underside of the line for resistance.
AUDUSD 4 HOUR

USDCAD WEEKLY

USDCAD is testing the top side of the line off of the 2018 and 2019 highs. This line was support in June. The trendline from the 2017 low, 200 week average, and February low are just below at 1.3170-1.3200. I’m focused on that zone for a low.


