Market Update 4/26 – Volatility Spills Over from FX
Market Update 4/25 – Fed Capitulates on Bonds
April 25, 2022Market Update 4/27 – Extreme Momentum Readings in GBPUSD
April 27, 2022
SPX DAILY
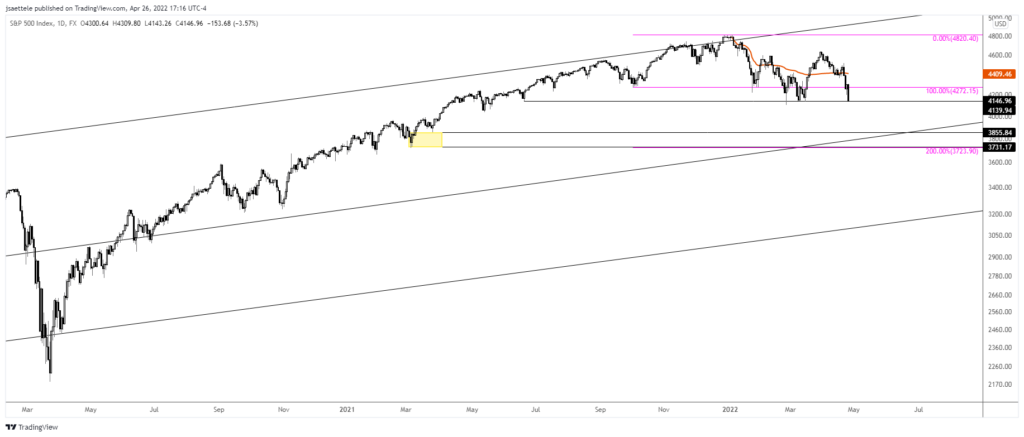
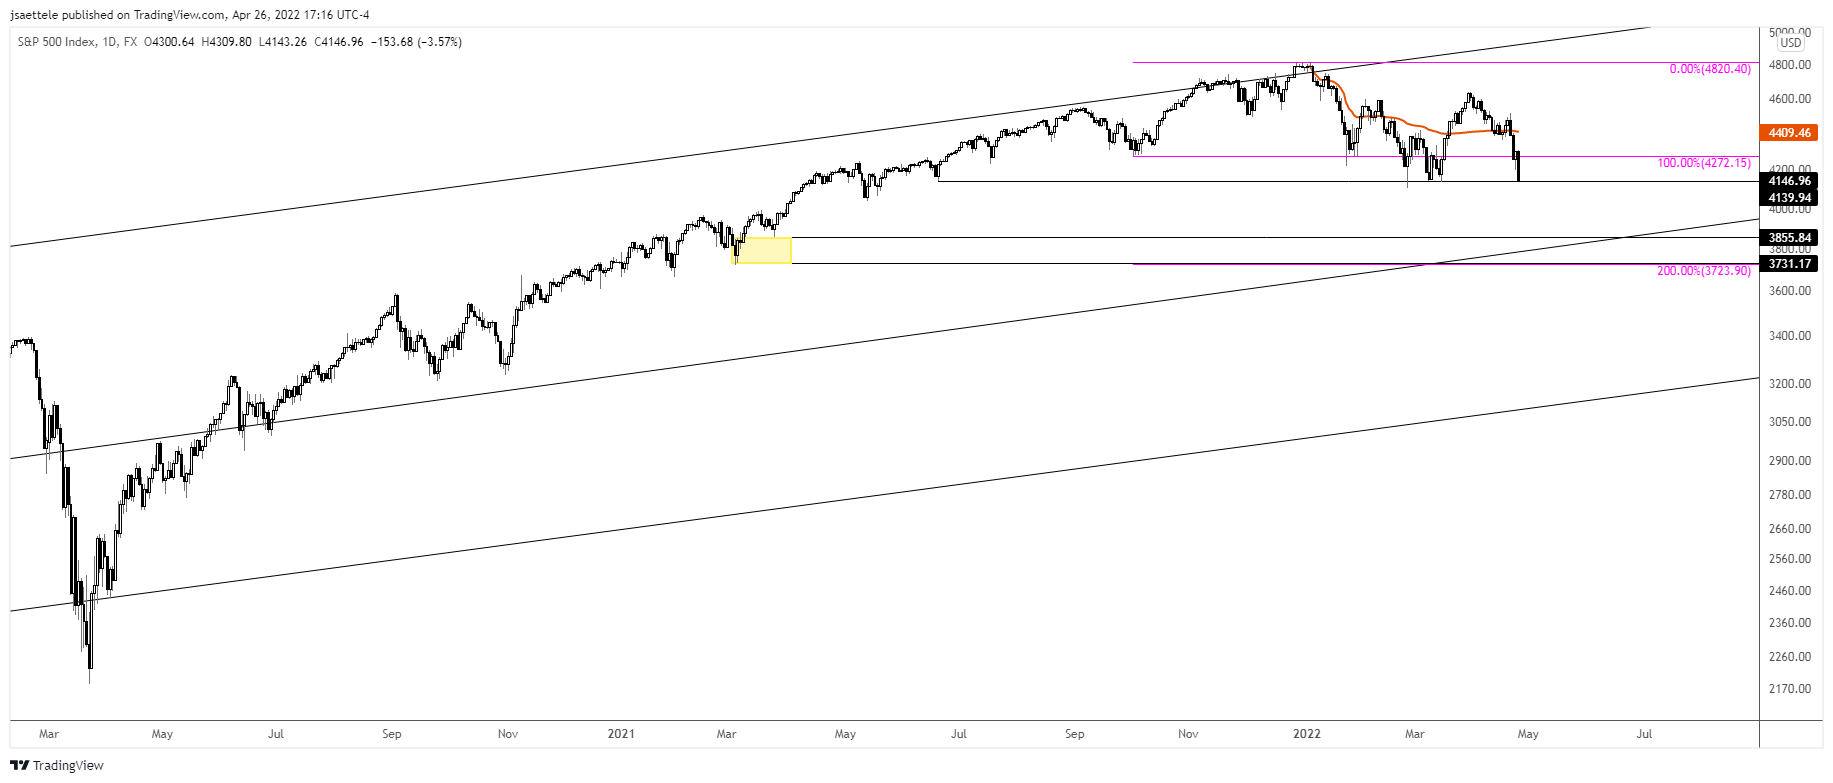
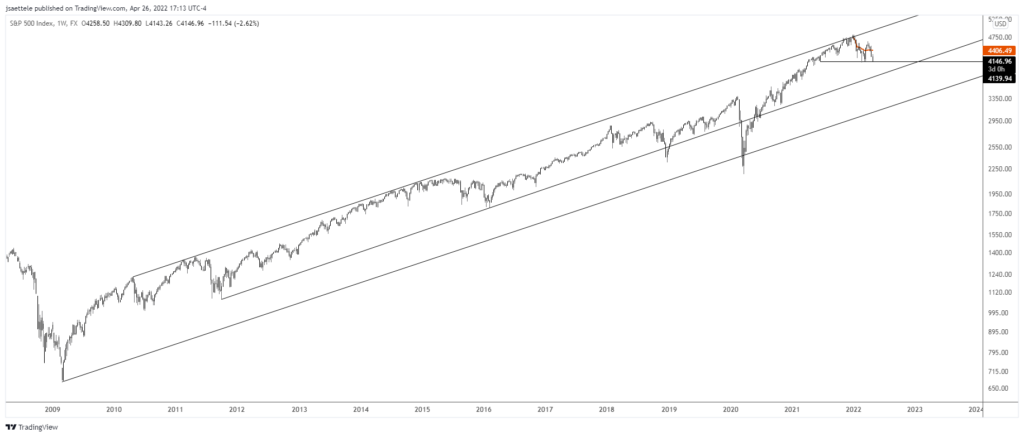
Heightened bond and FX volatility (notably JPY) has spilled over to equities. SPX is pressing yearly lows and there is no sign of a hold at this point. Price action since September is a distorted head and shoulders top with a negative sloping neckline…very bearish. The measured objective from the pattern is 3724. Barring a miraculous save, 3724-3856 looks like the next magnet. Recall that we started sounding the alarm on a top last September when price was pressing into the long term upper channel line (see below).
SPX DAILY
NASDAQ FUTURES (NQ) DAILY
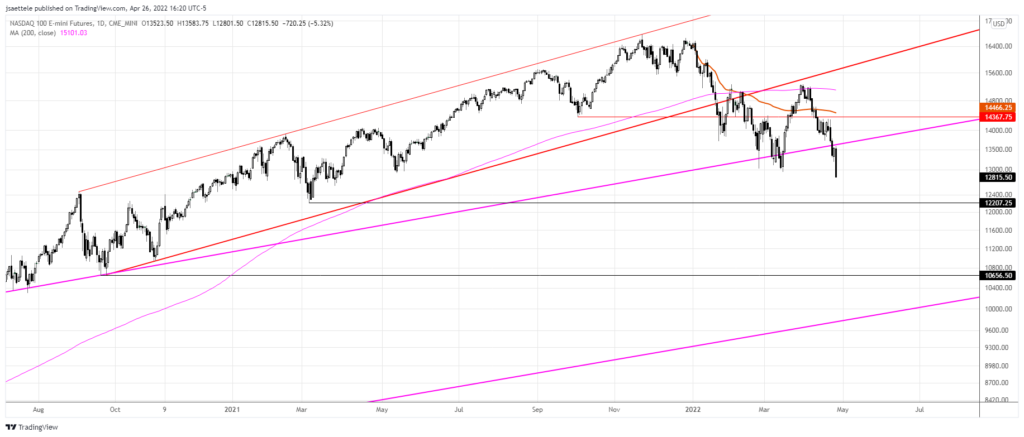
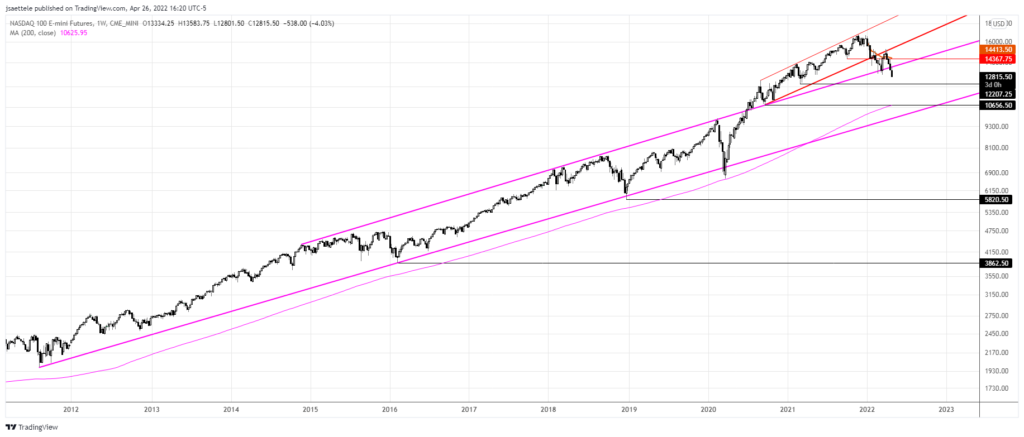
NQ has definitively broken the long term ‘pivot trendline’ (see zoomed out chart below). The next spot of interest is 12207 but it’s best to work in general information at the moment. That is, the trend is lower (price rejected by the 200 day average at the end of March and we’ve got lower lows and lower highs). There will be violent short squeeze rallies…maybe one from near 12207. The goal should be to identify the end of those rallies to short.
NASDAQ FUTURES (NQ) WEEKLY
BTCUSD DAILY
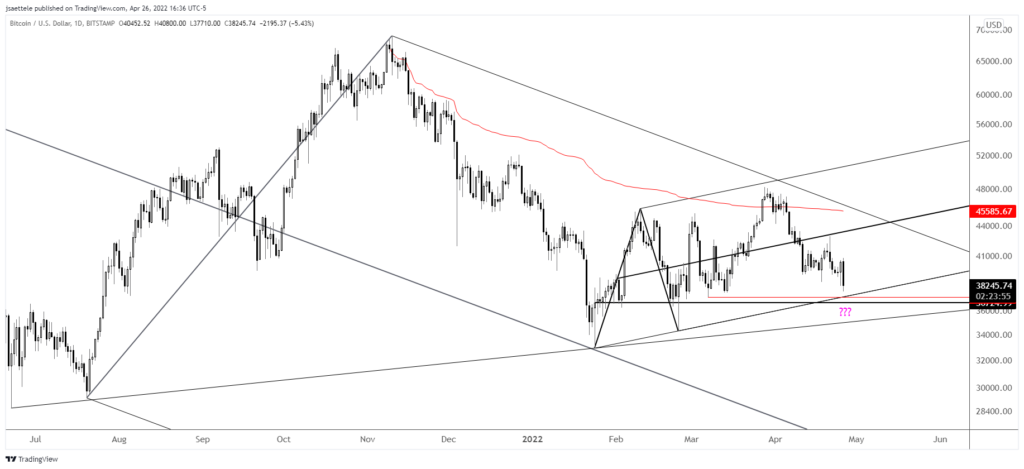
BTCUSD is nearing its own critical level defined by channel support and former lows at 37169. If price breaks below then that level becomes proposed resistance and everything since the January low would be viewed as a bearish flag of sorts and possibly the midpoint of the decline from the November high.
4/11 – BTCUSD bounced around the noted 42400 level for a few days before getting slammed today. Focus is lower until 36725, which is daily reversal support and the lower channel support. 42560 or so should be resistance now.
Do you make a profit trading BTC/USD?
Try our funded trader program and get up to $1,000,000 in funding.
Learn more
DXY DAILY
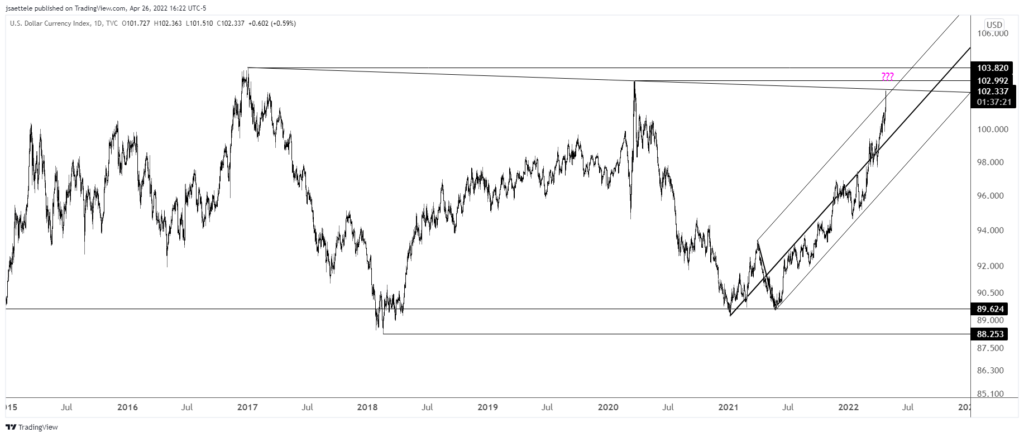
The wrecking ball that is the US Dollar just won’t stop. At this point, I see nothing to do other than identify possible key levels and act IF a reversal arises. This is one of those levels…defined by the line off of the 2017 and 2020 highs and upper parallel from the fork that originates at the 2021 low. Wait and see.
USDOLLAR DAILY
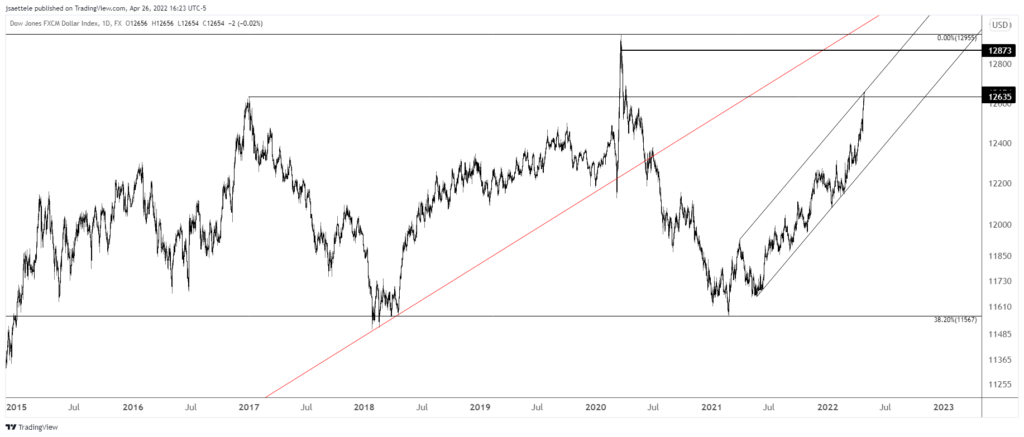
The other USD index that I follow, USDOLLAR, is also pressing into a potentially key level. This level is defined by the 2017 high and channel resistance. This certainly ‘feels’ like a blow-off top but without evidence that the market is heading the other way it’s extremely dangerous to short. Again, wait and see.
USDJPY 4 HOUR
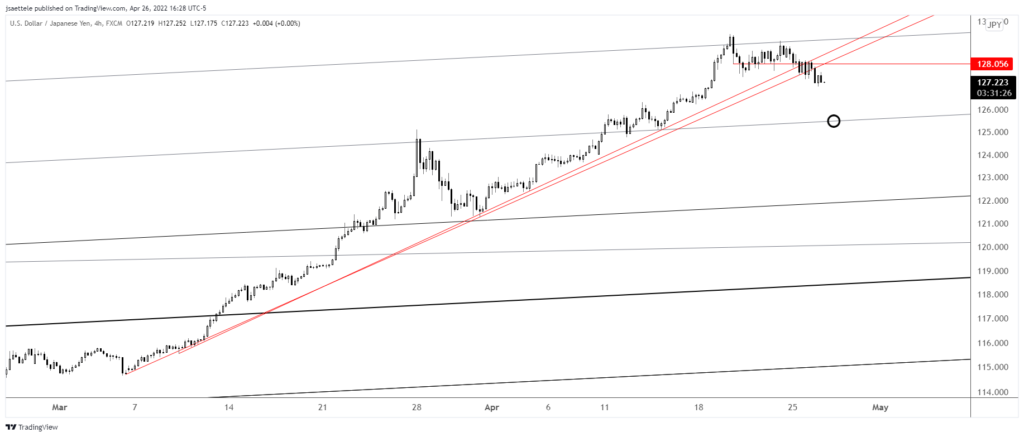
There IS evidence that USDJPY has reversed as the trendline from early March has been broken. The initial downside level of interest is the mentioned 125.30. Proposed resistance is 128.00ish.
4/20 – USDJPY didn’t quite make 130 but notice the channel from the 2021 low. 1/2 and full channel extensions are plotted with the channel. The March high was at the 1/2 channel extension. Today’s high was at the full channel extension. Near term focus is on the 1/2 channel extension near 125.30, which was formerly resistance. Near term, watch for resistance near 128.50 (see below). Finally, a volume reversal (on futures) triggered today. This is only the 3rd such reversal since 2014. Those charts are below.
AUDJPY WEEKLY
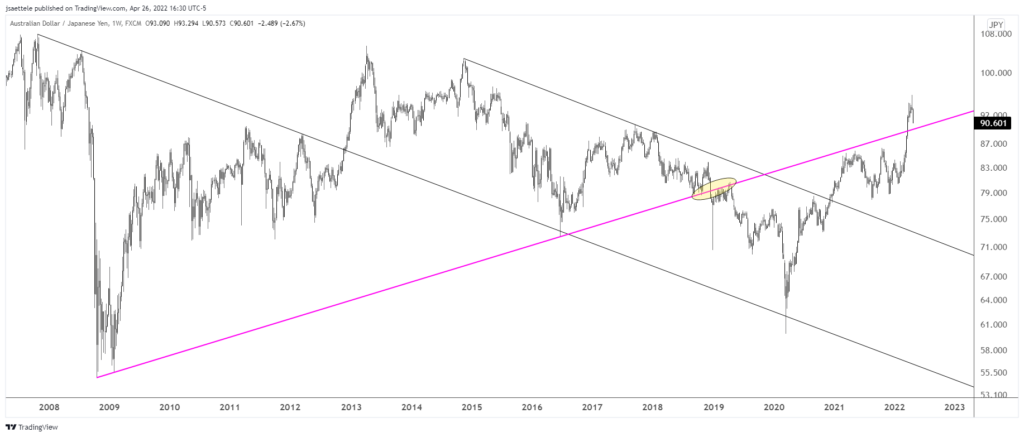
Keep an eye on 89.50 or so in AUDJPY for support. If there is a remarkable turnaround in risk assets, even if just a sharp counter trend rally, then this would be the place to participate. 89.50 is the top side of the trendline that extends off of the 2008 and 2016 lows. This line was precise support and resistance in 2018 and 2019 and just above the 2021 highs (if you recall we were looking to short into that line back then).
