Market Update – September 2
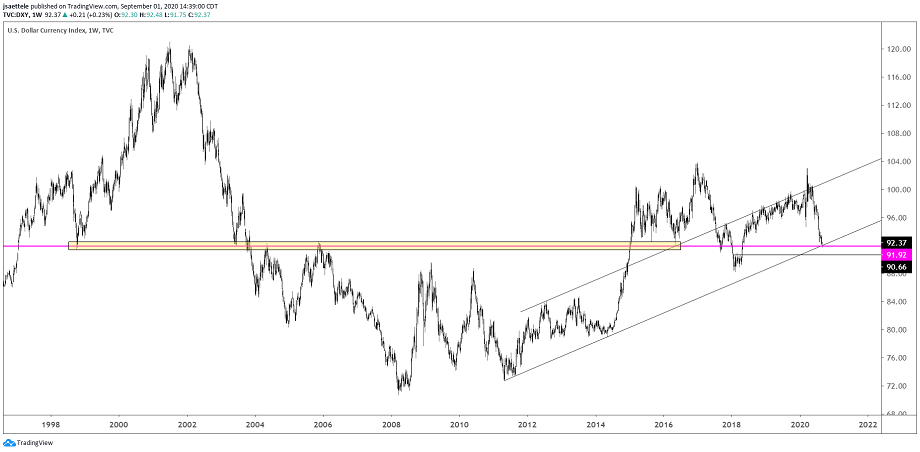
DXY WEEKLY
DXY traded 91.75 today before turning (exact midpoint between 91.50 and 92.00 by the way) higher. A daily volume reversal triggered in the process! We now have 2 triggers since 7/31, which is similar to the 2 triggers in January 2018 and summer 2018. Additional signals occurred in May 2016 and May 2014 (these are all circled on the chart below). Strength above 93.04 (high volume level from Powell’s Jackson Hole speech last Thursday) would break a 1 month wedge and suggest that the trend has reversed (hourly chart is below too).
8/30 – Is DXY still ‘trying’ to bottom? If so, then it needs to turn up around 92, which is the line off of the 2011 and 2014 lows (arithmetic scale). 91.50-92.00 has also been a major pivot since 1998. I sound like the boy who cried wolf but I’m on alert for a turn higher.
U.S. DOLLAR INDEX FUTURES DAILY

DXY HOURLY

EURUSD WEEKLY

EURUSD tagged the median line noted on Sunday near 1.2000 (high today was 1.2011). Back down to a 1.1400 handle, which is former resistance from the 25 line and former highs, in the coming weeks/months wouldn’t surprise (see zoomed in daily view below). Below 1.1750 would break the channel from the 5/14 low and month long wedge (see 4 hour chart below). Euro futures made a bearish volume reversal today. A similar cluster of triggers occurred in early 2018 and at the 2014 high. A bearish volume reversal also triggered on FXE (ETF), which hasn’t occurred since the 2014 high! These charts are below.
8/30 – EURUSD high on Friday is on the center line of the channel from the 5/14 low so a turn lower now wouldn’t surprise. My trading focus is on shorting a break under the lower parallel, currently about 1.1730. If price makes a new high, then pay attention to 1.2000/50, which is the median line of the fork from the 2015 low (not yet confirmed) and line off of the 2008 and 2014 highs.
EURUSD DAILY

EURUSD 4 HOUR

EURO FUTURES DAILY

FXE DAILY

GBPUSD WEEKLY

Cable high today was 1.3483. Keep this simple. 1.3500 is massive. This is the 2009 low, where price settled after Brexit prior to a final leg lower, and the 2019 high. The fork from the 2016 high was confirmed today as well. Strong reactions in the opposite direction tend to occur after the initial touch of the median line. If price does pull back, then pay attention to 1.2660-1.2790 (see daily chart below).
GBPUSD DAILY

USDCAD DAILY

USDCAD came within a hair of the year open today, which is 1.2987. I’ve mentioned in these pages over the years that reactions off of the year open offer great trading opportunities. For example, see the 2014 and 2018 examples. If I draw a trendline from the 2016 high and September 2019 high, you’ll see that price held the topside of that line today. This line is probably more appropriate because it cuts through many more highs and lows than if the line uses the January 2019 as the second pivot (see zoomed in chart below). What’s more, CAD futures made a bearish volume reversal today (bearish CAD is bullish USDCAD). As you’ll see on the last chart, the signals have been reliable in recent years. Above 1.3200 (trendline from March high) would suggest that trend has reversed higher in USDCAD.
USDCAD DAILY (ZOOMED IN)

CANADIAN DOLLAR FUTURES DAILY


