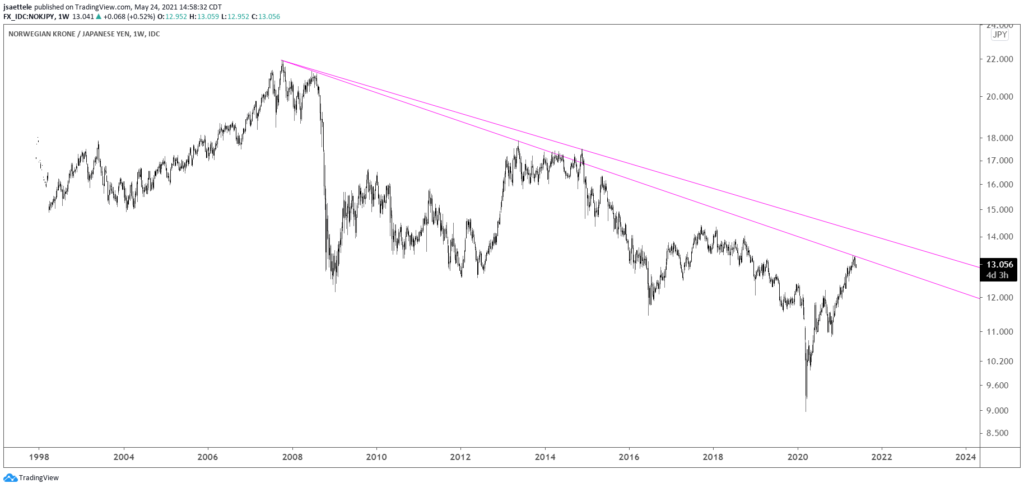
Market Update 5/24 – NOKJPY Idea
S&P 500 REAL EARNINGS YIELD
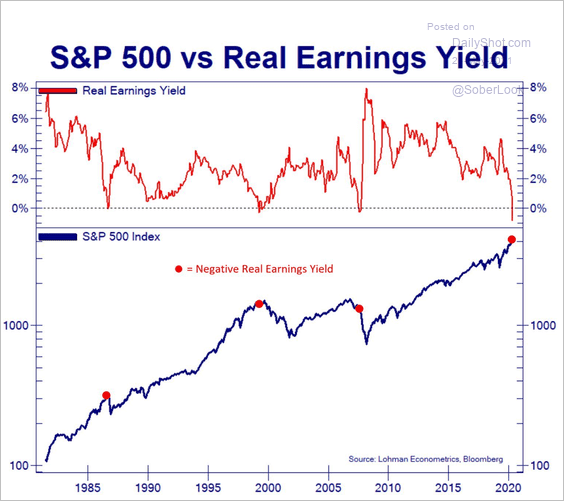
Adjusted for inflation, the S&P 500 earnings yield is back in negative territory. This previously occurred before the 1987 crash, the top in 2000, and the financial crisis.
COPPER FUTURES WEEKLY
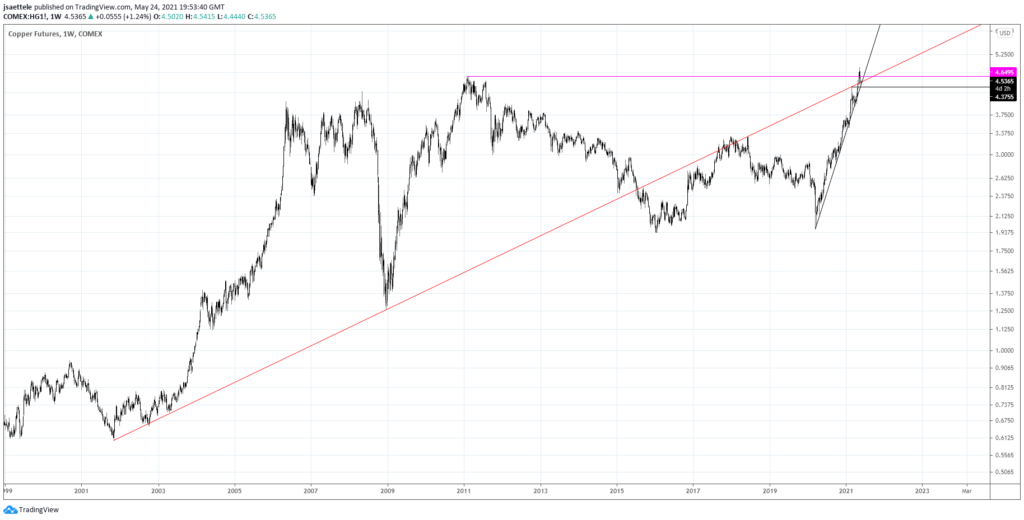
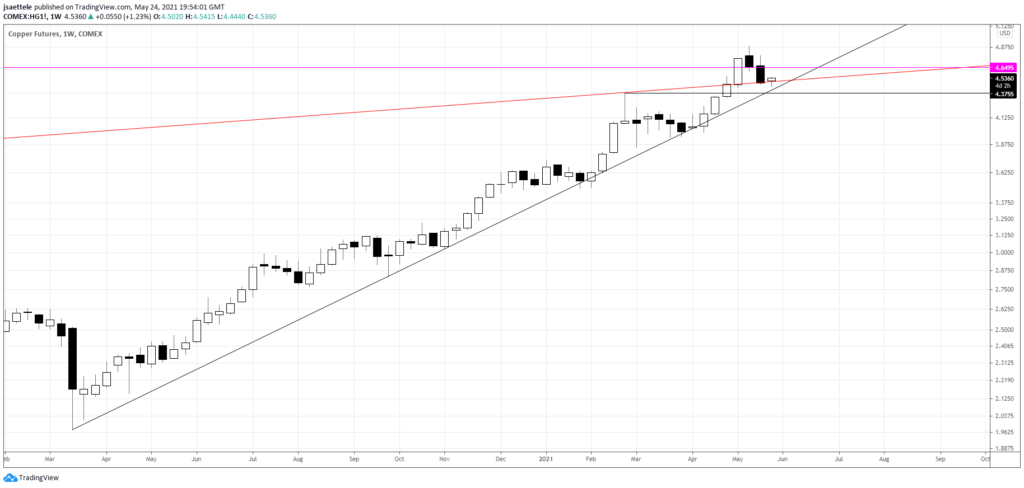
After trading to an all time high 2 weeks ago, copper put in a weekly reversal candle. Price followed through on the downside last week as well. This raises the specter of a massive failure after the move above the 2011 high. A close up view is below.
COPPER FUTURES WEEKLY
USDJPY 4 HOUR
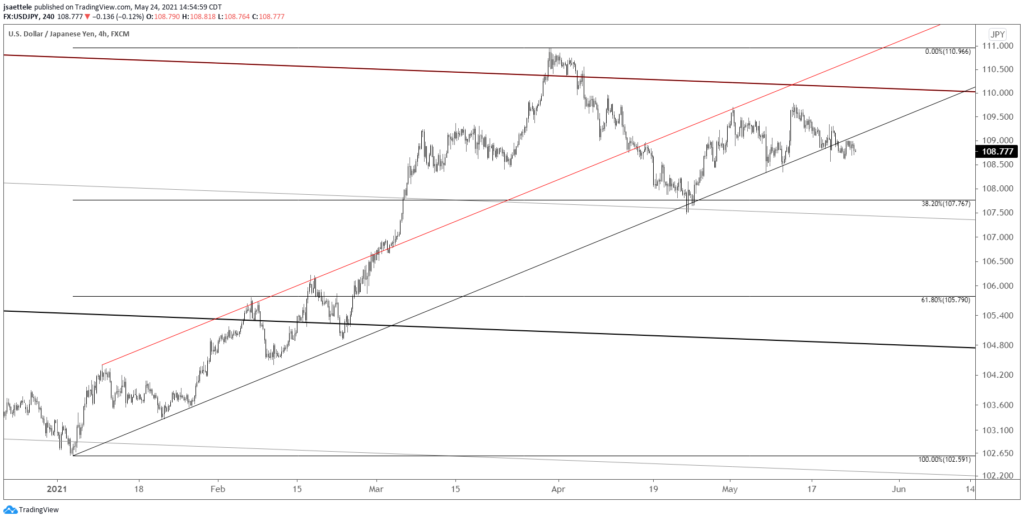
USDJPY may be trying to break down following Friday’s failure at 109.00. Still, ranges are pathetic and nothing more than noise at this point. I lean towards the downside but that doesn’t mean that price can’t continue to probe 109.00 or just above. I think there are better setups in other Yen crosses.
5/20 – USDJPY continues to press channel support. Today is the 9th day since 4/23 that price has touched the channel line. I’m ‘thinking’ breakdown eventually but market conditions at the moment are not conducive to range expansion. Watch for resistance near 109.10 (50 day average). If downside does materialize then the center line of the channel from the March high is a bounce level near 108.10.
USDNOK 4 HOUR
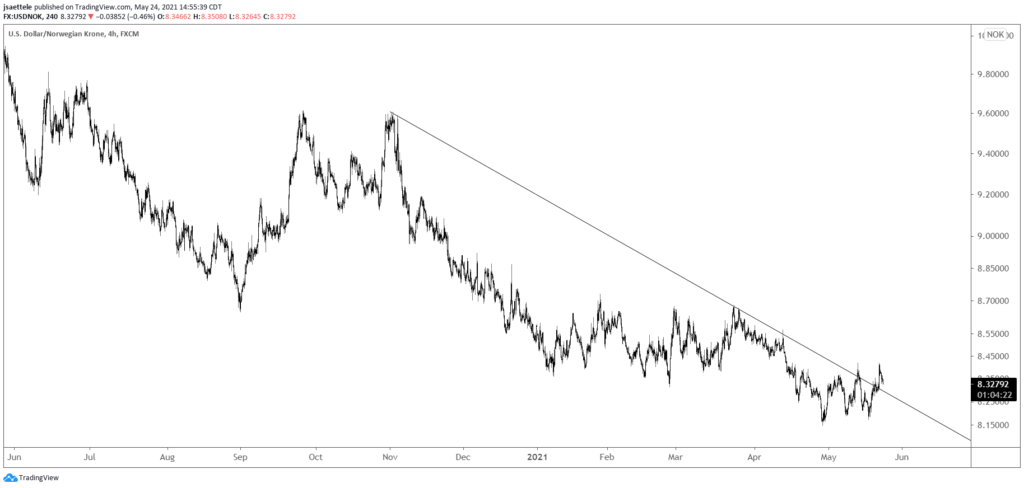
USDNOK broke above the trendline from the October high last week. The top side of that line is proposed support now near 8.2950. If action since the late April low is a bullish base, then I’d expect this to level to hold.
NZDJPY 4 HOUR
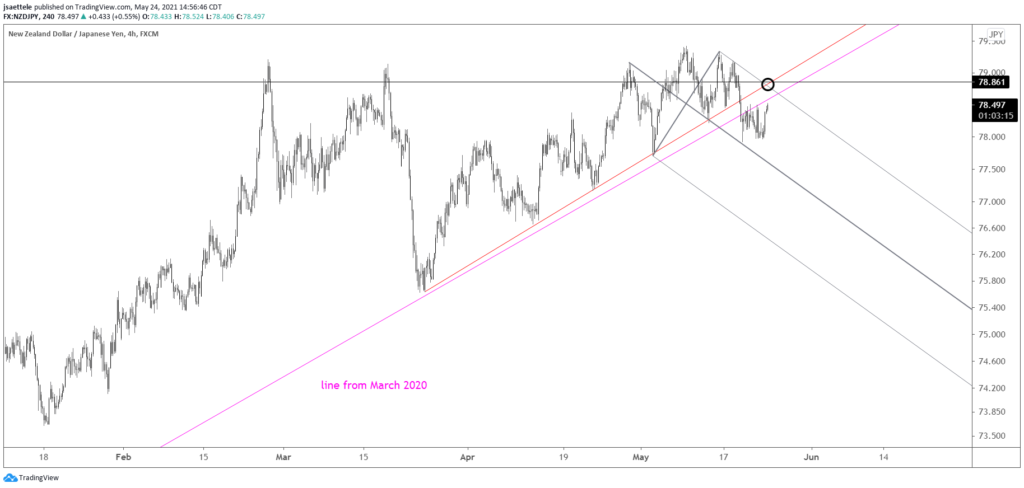
NZDJPY broke below the trendline from the March 2020 low last week. That line, along with the underside of the line from the 3/24 low (red line), is proposed resistance up to about 78.80.
5/18 – Keep an eye on NZDJPY. The trendline from March 2020 is about 78.30. A break below that line, which has held numerous times since late March, would warrant a short position.
NOKJPY DAILY
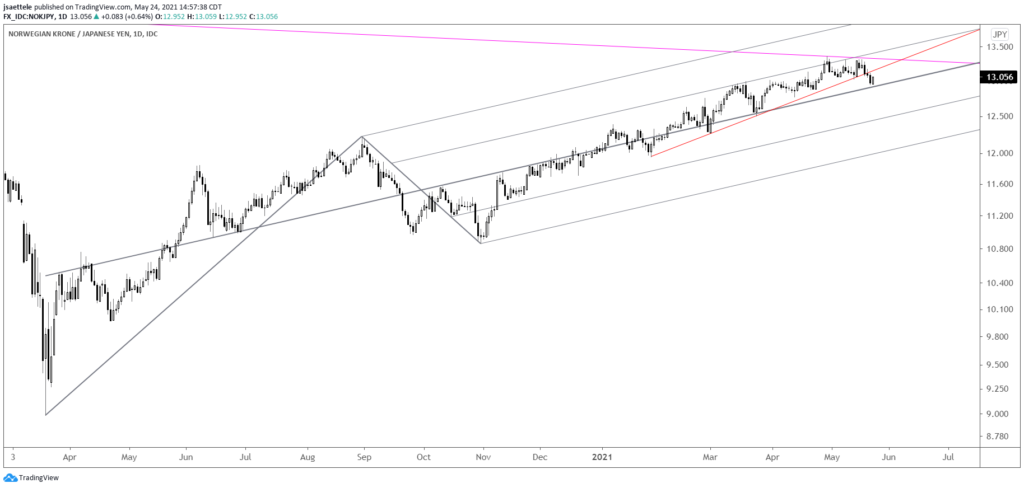
NOKJPY is an interesting chart. Price has rolled over from the trendline that connects the 2007 and 2013 highs. If a bigger down move is underway, then I’d expect resistance from the underside of the red trendline near 13.15. A longer term chart is below.
NOKJPY WEEKLY
