Market Update 6/1 – British Pound Reversal!
WOOD MONTHLY
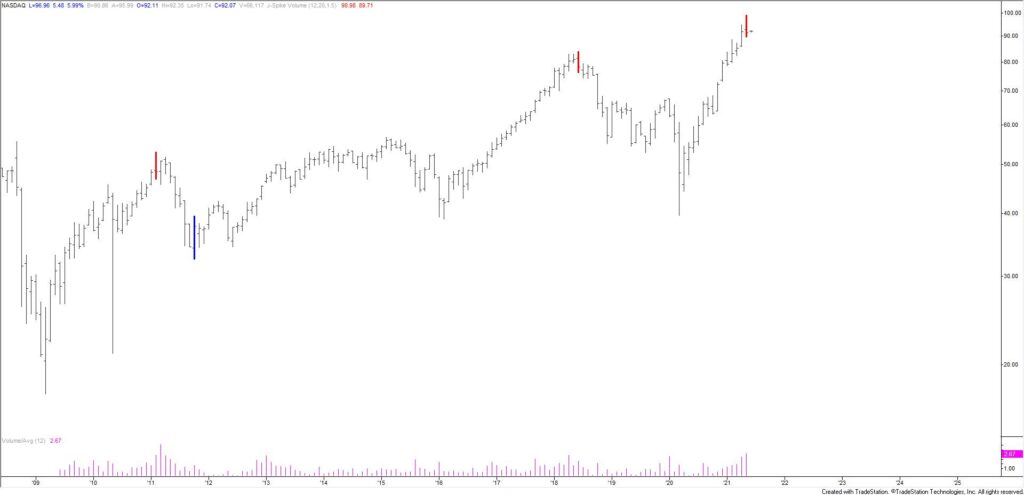
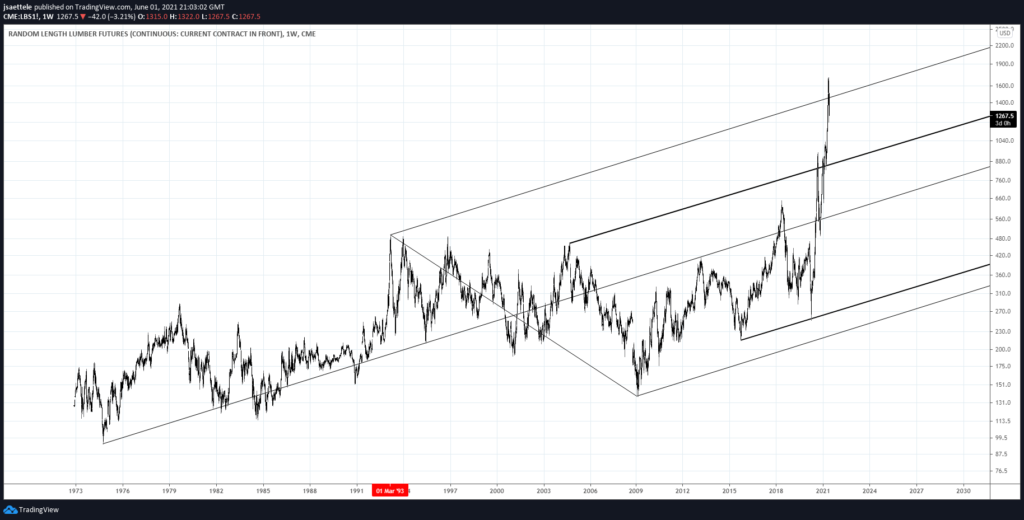
I’m starting with something a little different today. WOOD is the global timber and forestry ETF. A monthly volume reversal triggered in May. This ETF consist of companies with exposure to lumber so signals in WOOD can be used as a signals for lumber. Recall that lumber was one of the first (maybe the first) commodity to take off and reach an all time high in the early days of COVID. Does the monthly reversal indicate a temporary high (at least) for commodity inflation and therefore USD depreciation in general? Lumber futures (see below) reversed from resistance in May. Commodity currencies, notably NZDUSD (NZ is a big lumber exporter) tend to track lumber closely (see 2 charts down) too.
LUMBER FUTURES WEEKLY
WOOD AND NZDUSD WEEKLY CLOSES
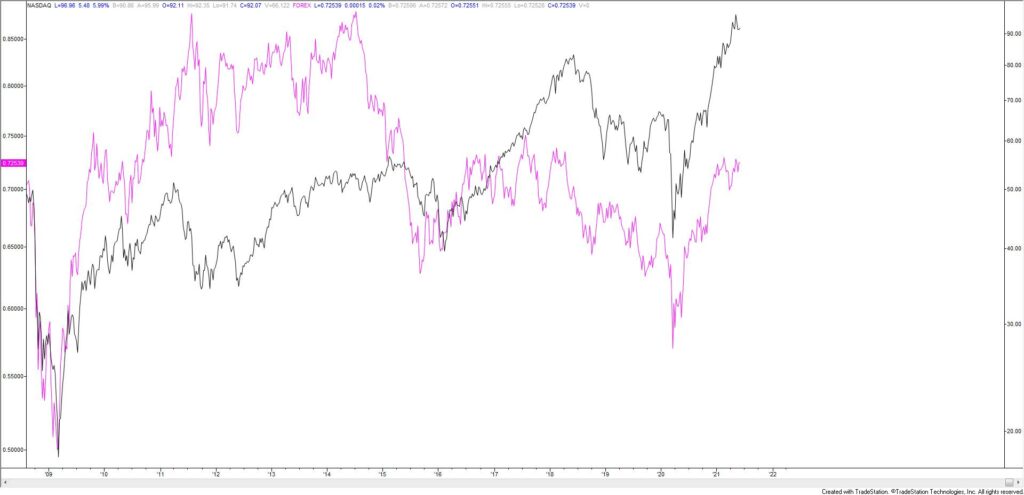
NASDAQ FUTURES (NQ) 4 HOUR
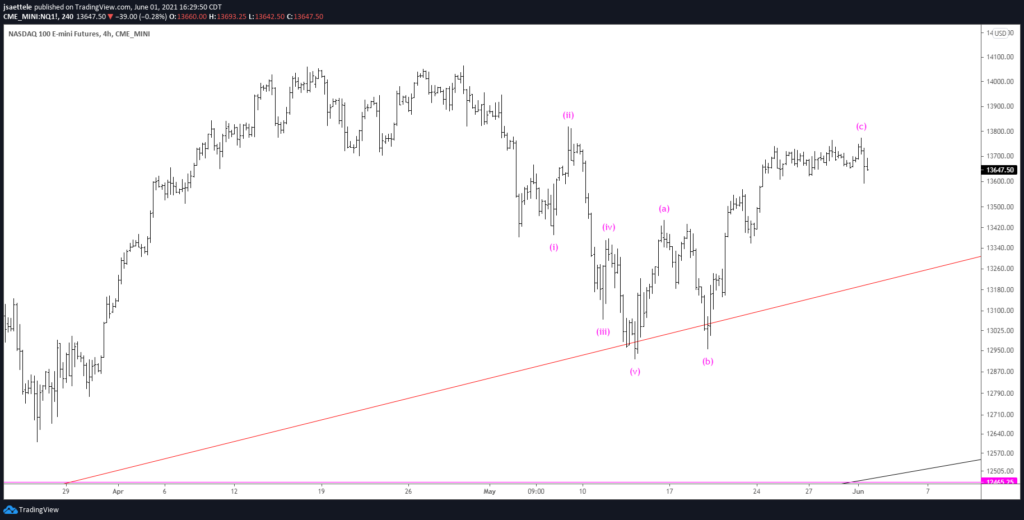
With today’s reversal lower in NQ, I lean towards the idea that a lower high is in place within a bearish sequence that began in early May. This view is based primarily on the Elliott pattern of 5 waves down and 3 waves up since early May.
5/20 – Confidence in direction in just about anything is nil right now but IF a broader risk off theme is emerging then I’d expect resistance in NQ near 13625. This is the 61.8% retrace of the decline from the top. What’s more, the decline from the top does count in 5 waves so expectations are for a lower high and another leg down.
U.S. DOLLAR INDEX FUTURES 4 HOUR
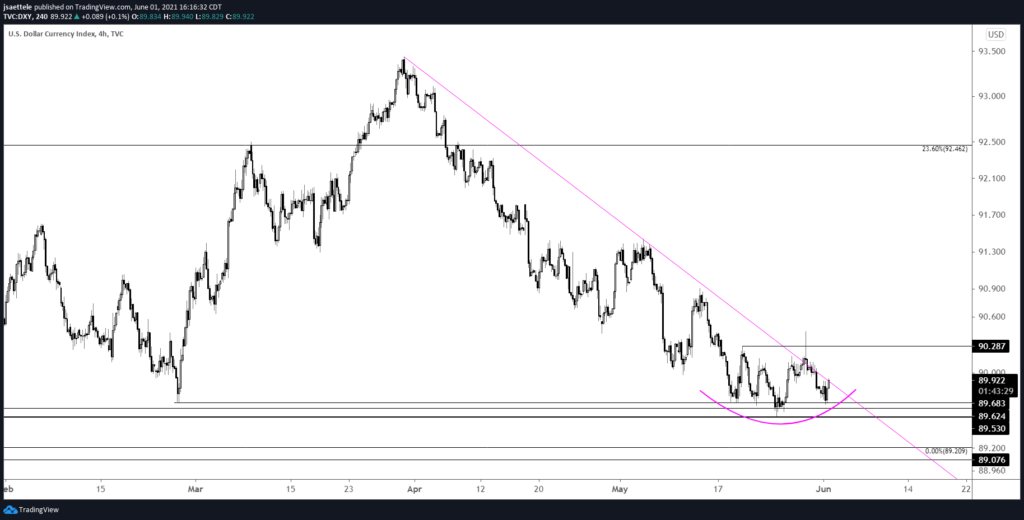
DXY sports a possible inverse head and shoulders pattern since 5/18. The neckline is 90.30 but price is testing trendline resistance now and a break above this line would turn me bullish before the neckline.
5/26 – DXY is also nearing trendline resistance. The level in question is about 90.20. A break above would warrant a bullish stance.
EURUSD 4 HOUR
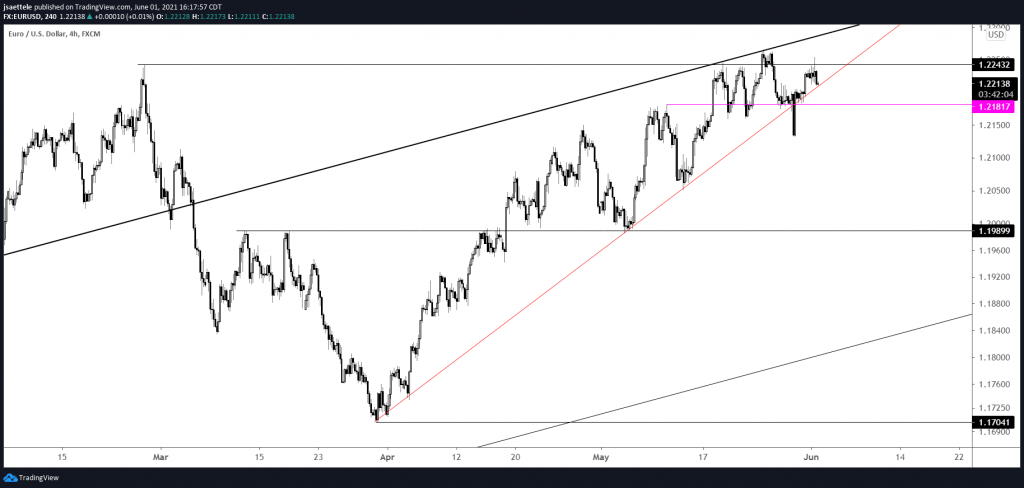
EURUSD is also testing its trendline from the April low. A drop below and re-test of the underside of the line would be ideal for entering the short side. 1.2180 is a possible short term bounce level.
5/26 – The EURUSD trendline is now about 1.2160. The situation is the exact opposite of DXY. A break below trendline support would indicate an important behavior change and warrant a bearish stance until further notice.
BRITISH POUND FUTURES DAILY
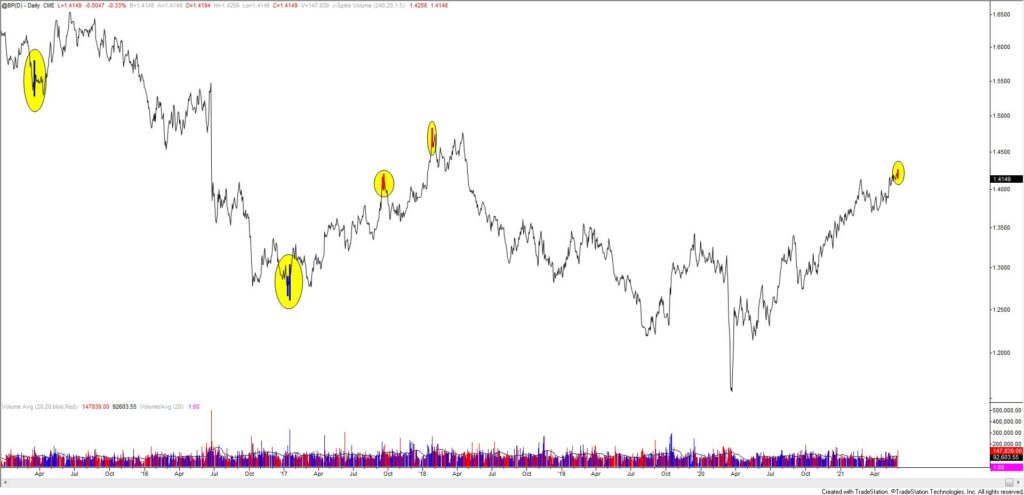
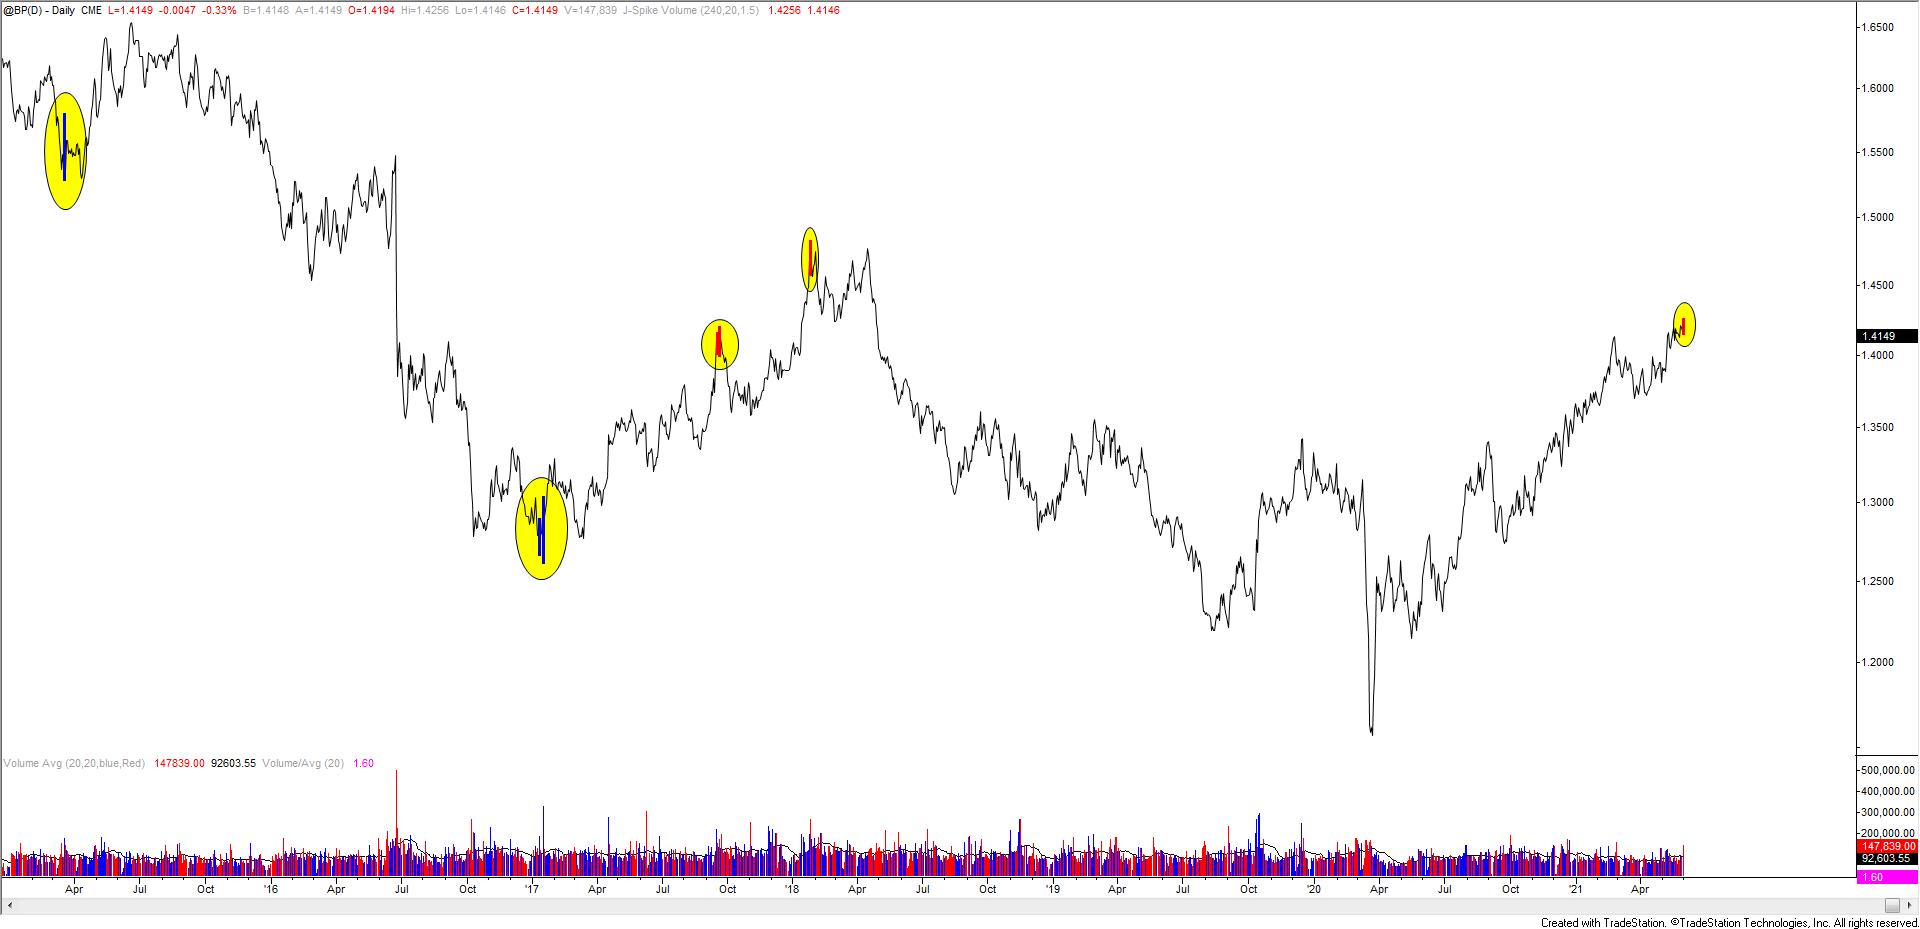
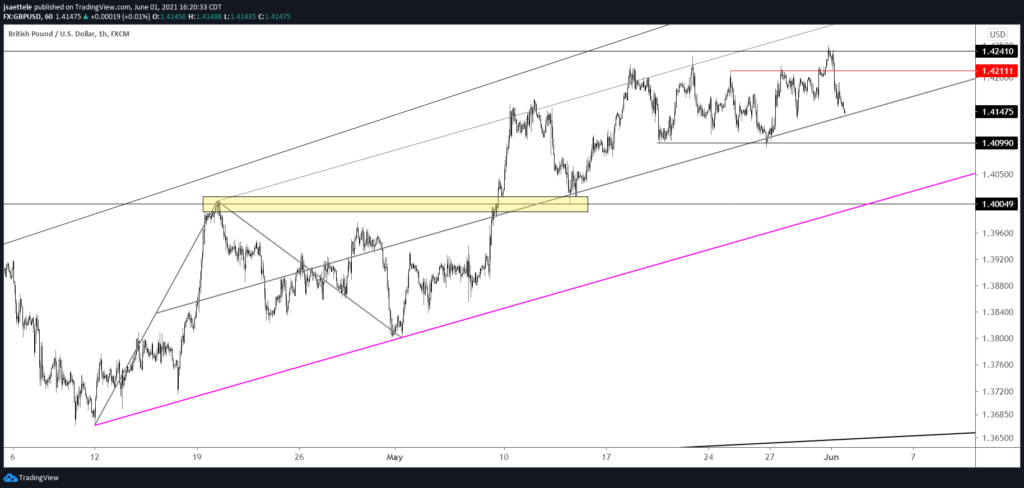
Pound futures made a daily volume reversal today. The signals shown are at least one year high/lows with at least 1.5 x the 20 day average volume. Those are some timely signals. Price is testing the center line of the channel from the April low (see spot chart below). In the event of a bounce, resistance is 1.4210. Near term downside focus is the lower parallel, currently near 1.4005.
GBPUSD HOURLY
USDJPY DAILY
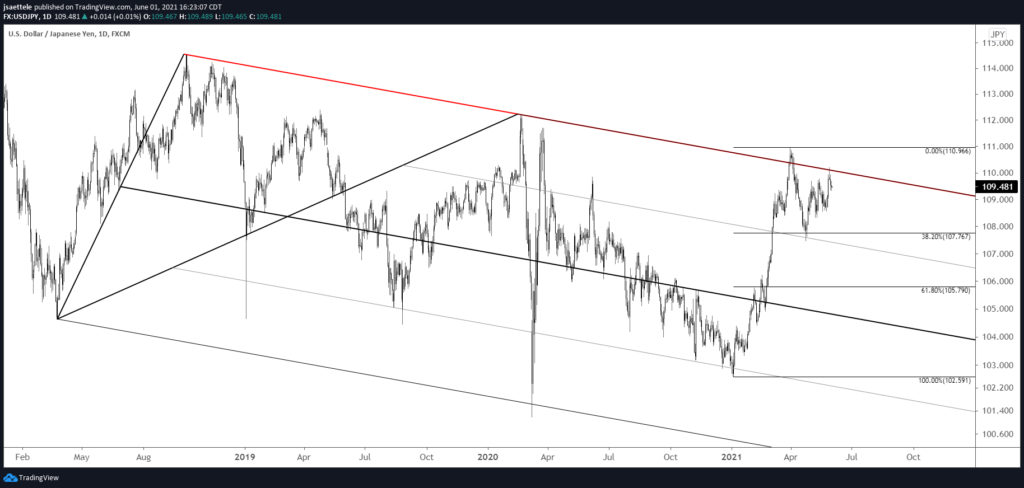
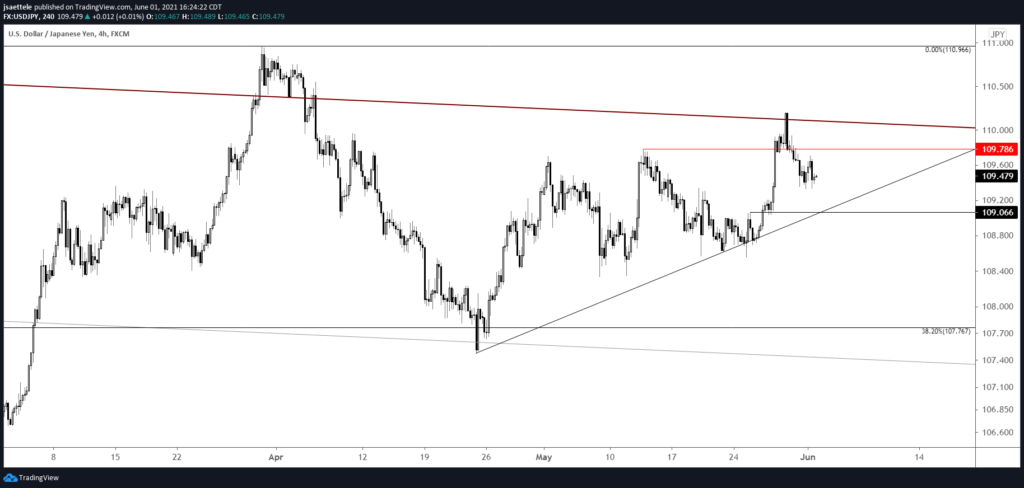
Last week, USDJPY reversed lower right at channel resistance from the 2018 high. Top in place? If so, then 109.80 should provide resistance (see 4 hour chart below). Short term trendline support is near 109.00. A break below would warrant a bearish bias.
USDJPY 4 HOUR
