Market Update – August 20
USDOLLAR DAILY
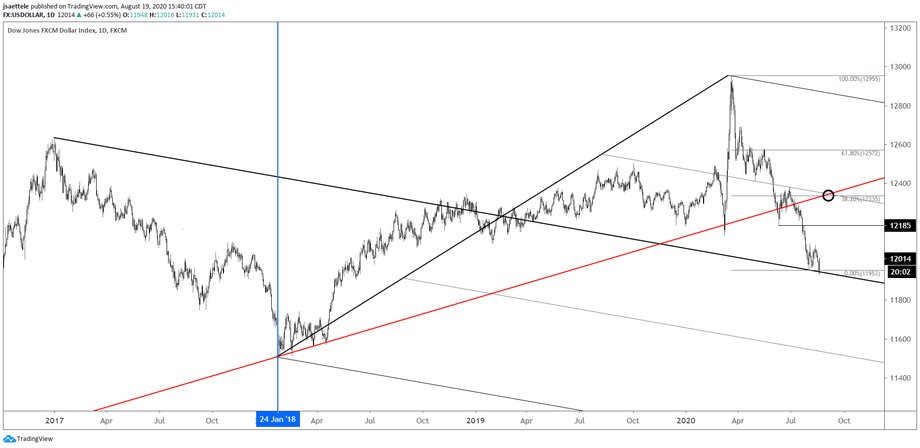
USDOLLAR dipped under the 8/2 low today and reversed sharply. Today was a bullish outside day, just like 8/2 (close up chart below). I view today as a re-test / fake-out and still favor upside with the previously mentioned 12350 or so as ‘swing’ upside to target. Near term, the March low at 12129 is a possible reaction level.
8/2 – Low on Friday was 11953…right on the median line, which is a great spot for a swing low. Bullish USD here with tight risk makes sense and I can envision a ‘surprise’ rally back to 12350 or so over the next 6 weeks. Near term, pay attention to the channel from the March high. The median line is about 12080.
USDOLLAR DAILY

USDSEK 4 HOUR

USDSEK undercut the 7/31 low on 8/6 and again this week before turning up today. My view, that 5 waves down from the March high, are complete has not changed. A commensurate corrective advance towards the former 4th wave high at 9.4799 is favored.
8/3 – USDSEK nailed support and reversed higher on Friday from the noted channel extension and Fibonacci relationship. I’m looking for a sizable rebound in the coming weeks and maybe longer. Near term levels to pay attention to are the center line of the channel from the March high near 8.89 and the upper parallel, which is currently about 9.10.
EURUSD 4 HOUR

The previously described triangle scenario didn’t pan out. Rather, EURUSD finished off its ‘5th of 5th’ wave quickly. Fine, just get it over with. Near term, I’m paying attention to the parallels within the channel from the 5/14 low for a precise short entry. The high was on the 75 line within the channel so the most likely spot for the next reaction is the 25 line (concept of symmetry) near 1.1750. This line is important as well because it was resistance throughout July. If price bounces from there then the underside of the median line is proposed resistance. The biggest test for bulls is the lower parallel near 1.1650.
GBPUSD DAILY

The triangle scenario in GBPUSD didn’t pan out either. Instead, GBPUSD carved a bearish outside day off of the year open price at 1.3250. A J-Spike also triggered (magenta bars…a key reversal with a volatility filter). The median line is a near term reaction level near 1.3060. Proposed resistance is 1.3170/85 (prior highs). Generally speaking, I’m looking towards the 200 day average and line off of the March and June lows near 1.2750.
AUDUSD DAILY

AUDUSD made a bearish outside today after tagging the 200 week average (see weekly chart below…recall the similarity to June 2002). Today was the 2nd bearish outside day since 8/7 and 3rd key reversal since 7/31. Proposed resistance is Monday’s low at .7209 and the important test on the downside is the June high and 7/24 low at .7064.
8/5 – Over the last 20+ years, AUDUSD trends have confined to well-defined channels. As shown several times over the last week, price is currently testing the upper boundary of the bearish channel from the 2011 high. The 200 week average is currently .7257. Today’s high is .7241. The technical situation is similar to June 2002 (circled), when AUDUSD pulled back sharply from the channel / moving average combo. That pullback was the first correction within a long term bull. I’m of the mind that something similar occurs now (sharp pullback to reset sentiment for a much larger move higher). Price continues to respect the short term channel (see short term chart below) so today may have been the high. Consider too that NZDUSD didn’t make a new high with AUDUSD (non-confirmation). If price drops under the center line (about .7160) from this channel then pay attention to the underside of the line for resistance.
AUDUSD WEEKLY

NZDUSD DAILY

Kiwi downside remains favored. Over the last week, the upper and lower parallels of the short term bearish channel have nailed the pivots. Resistance should be .6575/85 (8/3 low and June high). Initial downside focus is still .6380, which is now joined by the 200 day average.
8/16 – NZDUSD broke the channel from the March low and initial downside focus is the former 4th wave low at .6380. Price is sitting on the lower parallel from the short term bearish channel. If price breaks below, then the underside of that line becomes resistance. If price bounces here, then .6585-.6600 is proposed resistance.
USDCAD WEEKLY

USDCAD turned up today after trading under the 200 week average. The 200 week average has historically been a great trend filter and pivot. I love that price has turned up from the top side of the trendline from January 2016, the line off of the 2017 and December 2019 lows, and the 200 week average. Broad upside focus is 1.3660-1.3715. The top of this zone is the 6/26 high and 38.2% retrace of the decline from March. The high volume level today is 1.3191, which is also the 8/13 low. Watch there for support.
8/6 – USDCAD is testing the top side of the line off of the 2018 and 2019 highs. This line was support in June. The trendline from the 2017 low, 200 week average, and February low are just below at 1.3170-1.3200. I’m focused on that zone for a low.
USDCAD WEEKLY


