Market Update 2/17 – EURUSD 1.2000 is Big
OTC TRADING VOLUME
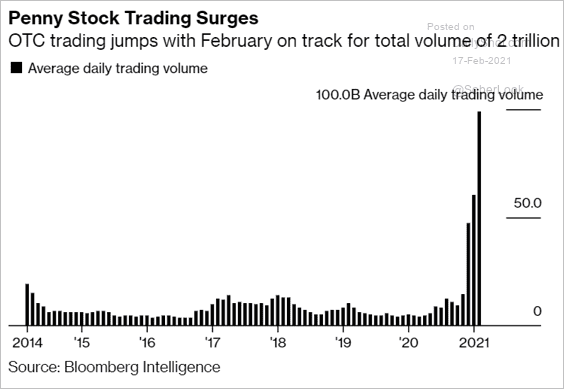
Another day and another chart comes across my desk that highlights extreme investor behavior…and therefore an extremely prices equity market. ‘Penny stock’ trading volume in February (there’s a week left too) dwarfs anything we’ve ever seen. When the tide turns, the drop is going to be calamitous.
S&P 500 FUTURES (ES) DAILY
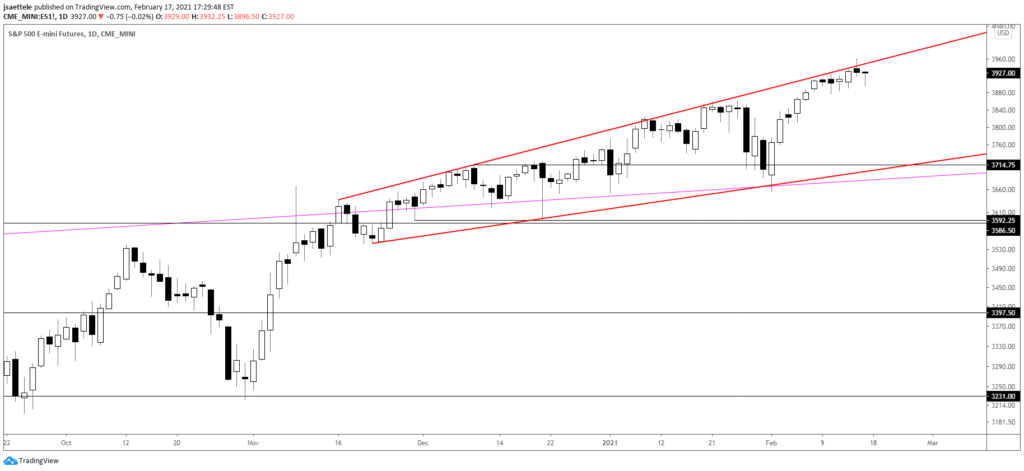
ES price behavior since mid-November takes the form of a rising wedge. In Technical Analysis of Stock Trends, Robert Edwards and John Magee wrote the following (over 70 years ago);
The Wedge is a chart formation in which the price fluctuations are confined within converging lines. A Rising Wedge occurs when both of these converging lines slope upwards….and betrays a gradual petering out of investment interest. Even though prices are advancing, each new up wave is feebler than the last. Finally, demand fails entirely and the trend reverses. Thus, a Rising Wedge typifies a situation which is growing progressively weaker in the technical sense.
The bottom of the wedge is currently about 3705. Price has been riding along the upper wedge line for almost 2 weeks. When/if that lower wedge line breaks, I’ll discuss downside targets.
2/10 – ES hit the line that crosses highs since November and made a large outside day today (engulfed the prior 2 days). The day ended with a doji (not perfect but close enough). The trendline and candlestick combination suggest that this could be a top of sorts.
EURUSD 4 HOUR
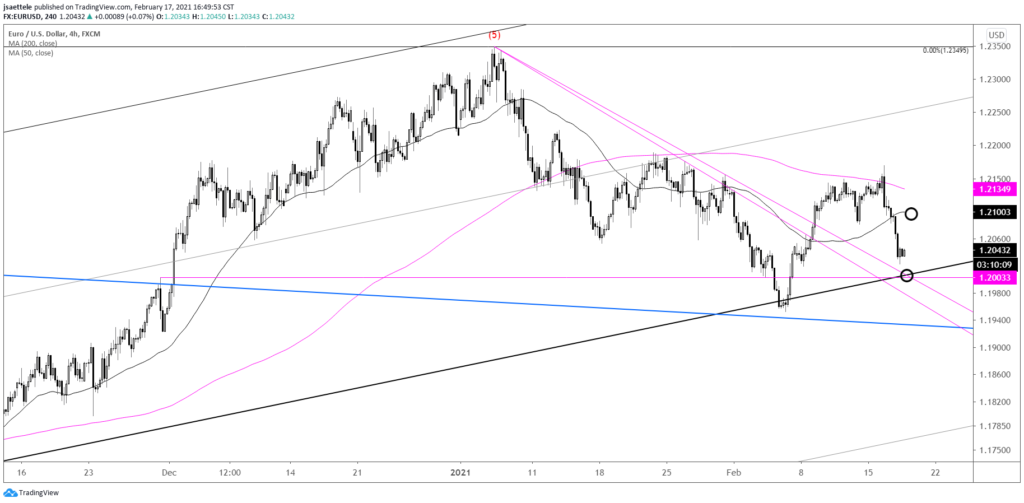
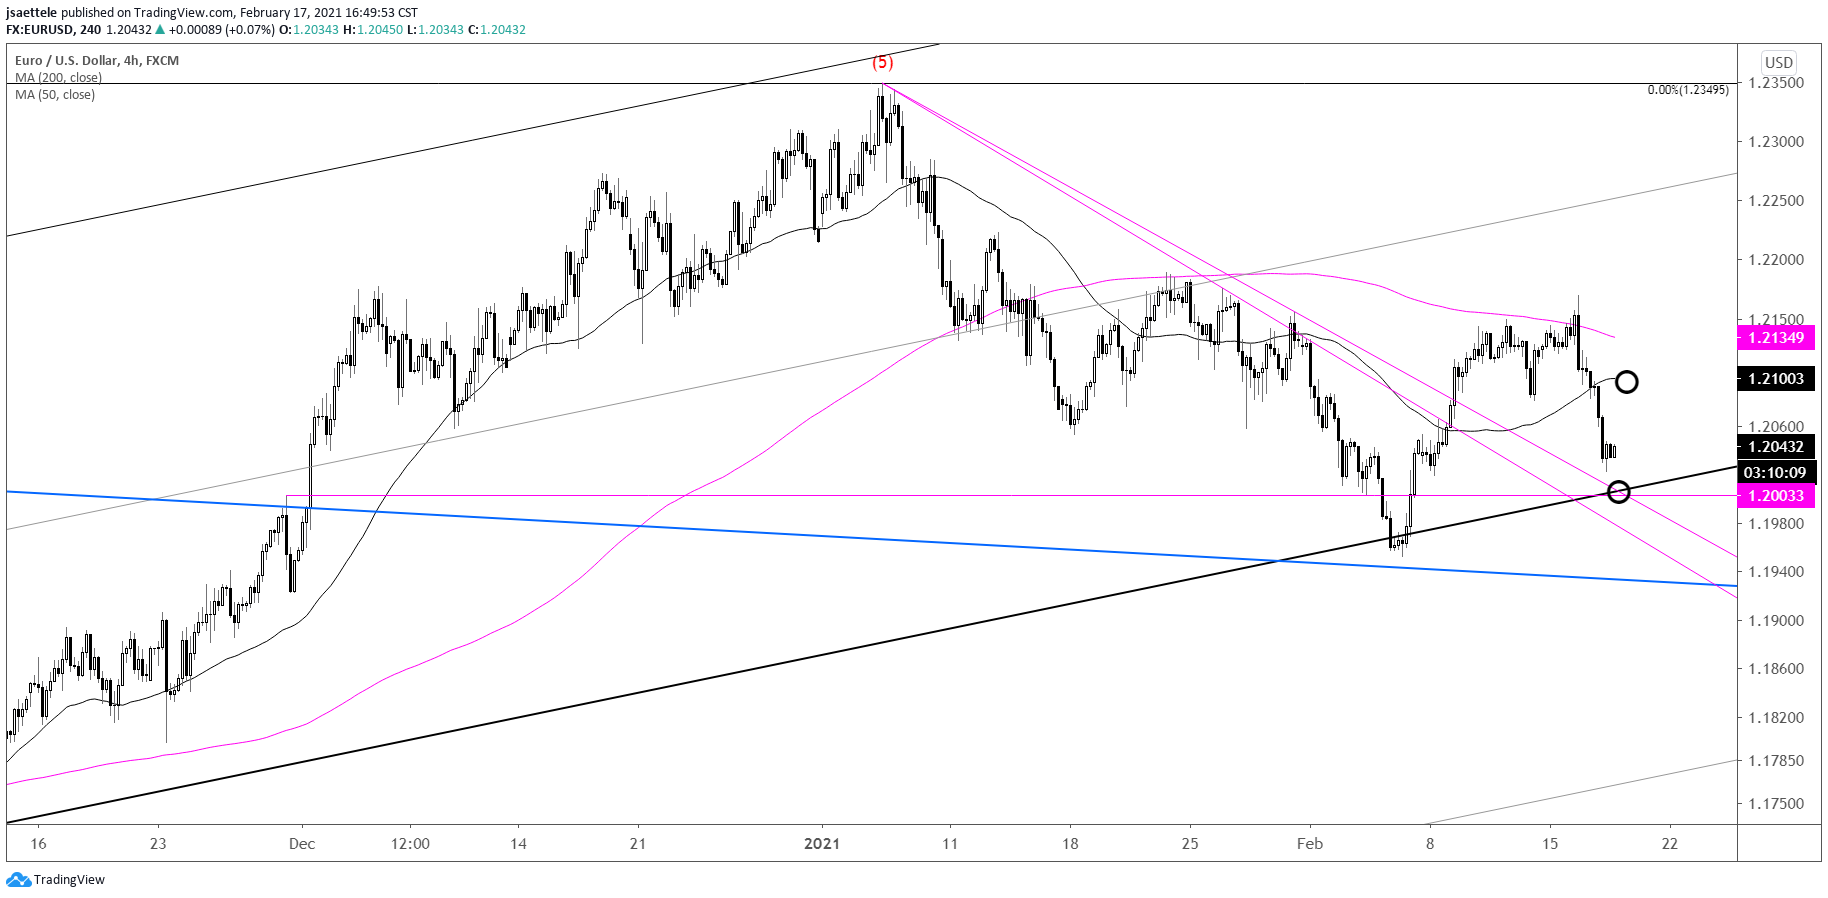
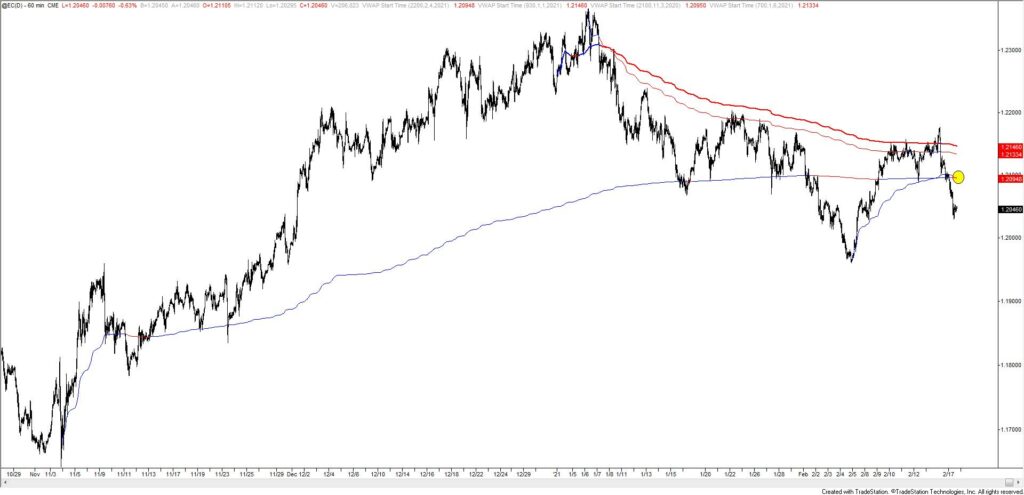
1.2000ish remains a possible bounce level for EURUSD but I’d keep an eye on 1.2090-1.2100 for resistance now too. The level is defined by VWAPs from the November and February lows (see futures chart below). These VWAPs were previously support. Now broken, watch the lines for resistance.
2/16 – Today’s EURUSD spike and reversal puts the finishing touches on what I think is a small B wave. Near term focus is 1.2000. It’s not out of the question that this high is more important though. The reversal occurred at 2021 VWAP and the 50 day average (see futures chart below) and don’t forget that USD seasonality is strong for the next 5 weeks (noted in yesterday’s post).
EURO FUTURES HOURLY
USDJPY 4 HOUR
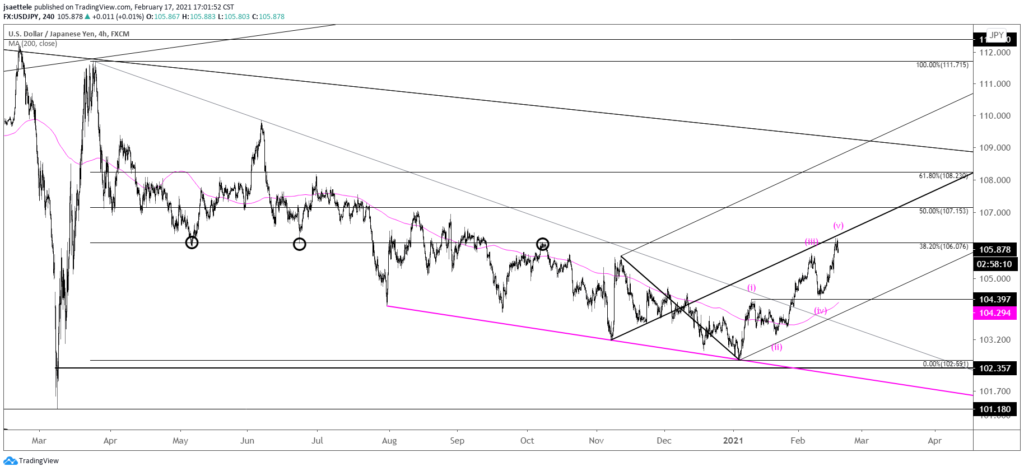
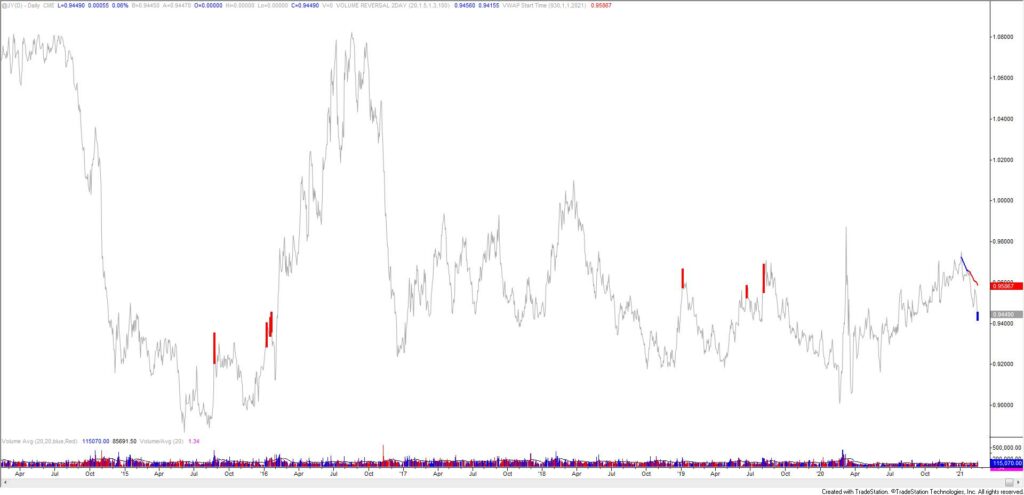
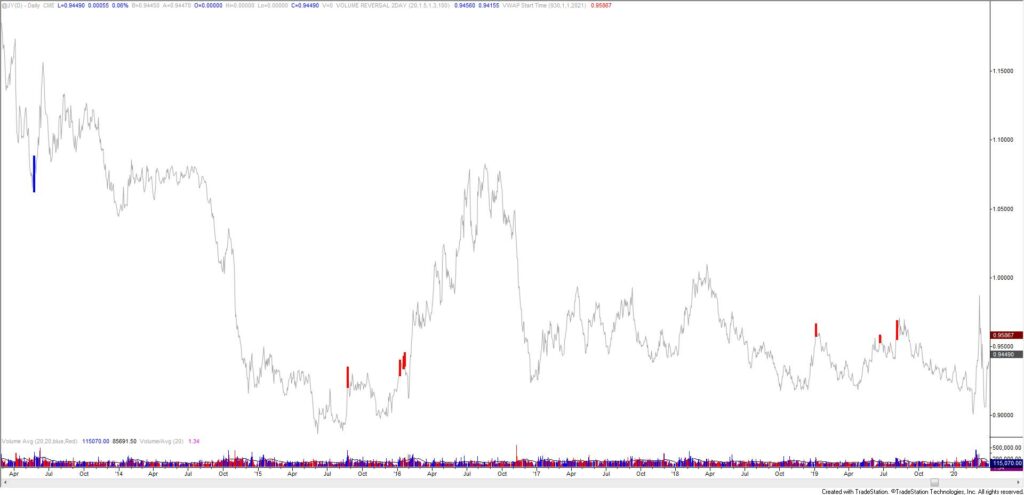
USDJPY high today was 106.22…beautiful. 5 waves up may be complete at today’s high. A 2 day volume reversal also triggered today. This is the first such bullish Yen reversal (bearish USDJPY) since May 2013 (futures charts are below). I’m looking lower.
2/16 – The USDJPY rally is in 5 waves and price is nearing a potential resistance from the 38.2% retrace of the decline from March and the median line of the bullish fork (about 106.20) from the November low. The May low, June low, and October high are 106.00/10 as well. It’s not a coincidence that TLT and USDJPY are nearing possible pivots simultaneously.
JAPANESE YEN FUTURES DAILY
JAPANESE YEN FUTURES DAILY
AUDUSD 4 HOUR
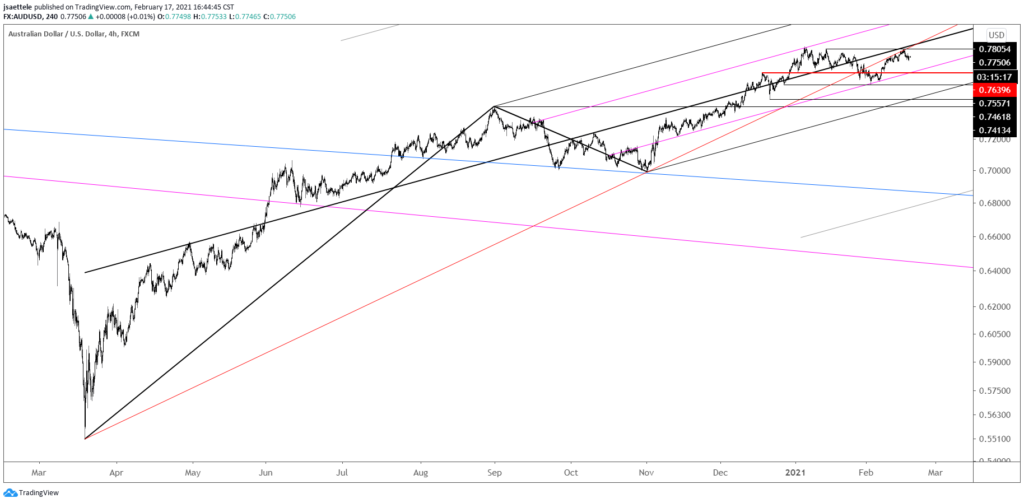
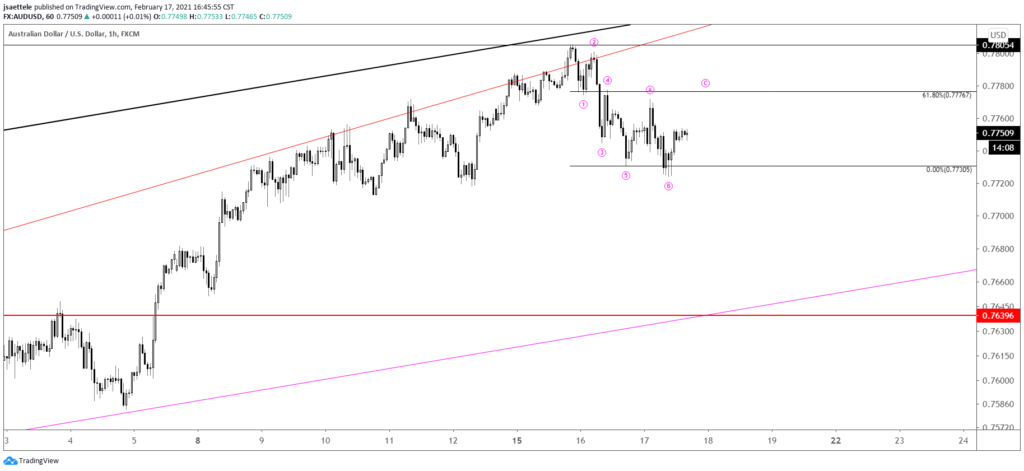
I’m continuing to look towards .7640 in AUDUSD. The hourly chart below shows a possible near term outcome in which price is working on a flat correction following a 5 wave decline. If that interpretation is correct,then resistance should be near .7777.
2/16 – AUDUSD has turned down following the spike through .7760. The structure of the rally from the 2/2 low isn’t clearly impulsive or corrective so I’m just paying attention to levels for now. .7640 and .7660s should be watched for possible support now.
AUDUSD HOURLY
USDCAD HOURLY
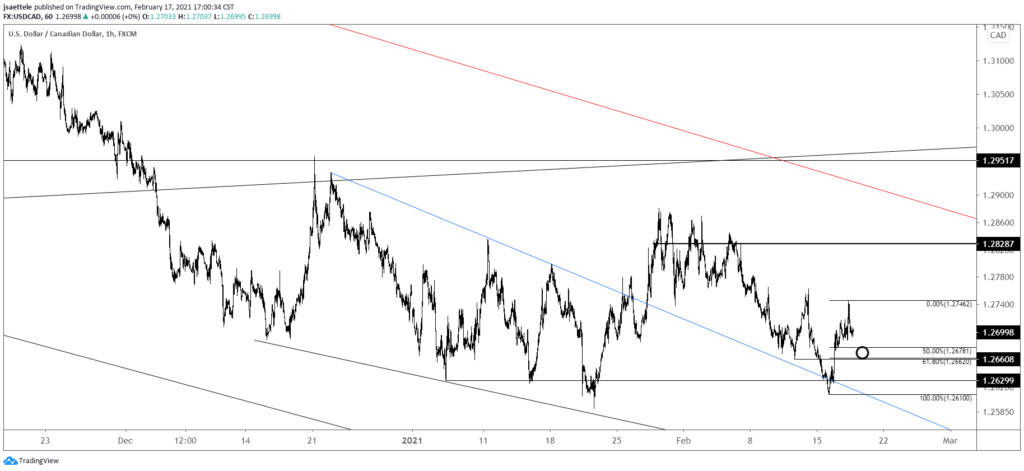
As suggested yesterday, it appears that USDCAD completed an impulsive rally today and proposed support is now 1.2660/80. Watch for a higher low in that zone.
2/16 – USDCAD reversed today from the top side of former trendline resistance. Very short term, the rally from today’s low is unfolding in an impulsive manner and a small pullback could materialize from near 1.2620. Proposed support against today’s low is 1.2650/60.
NZDUSD DAILY
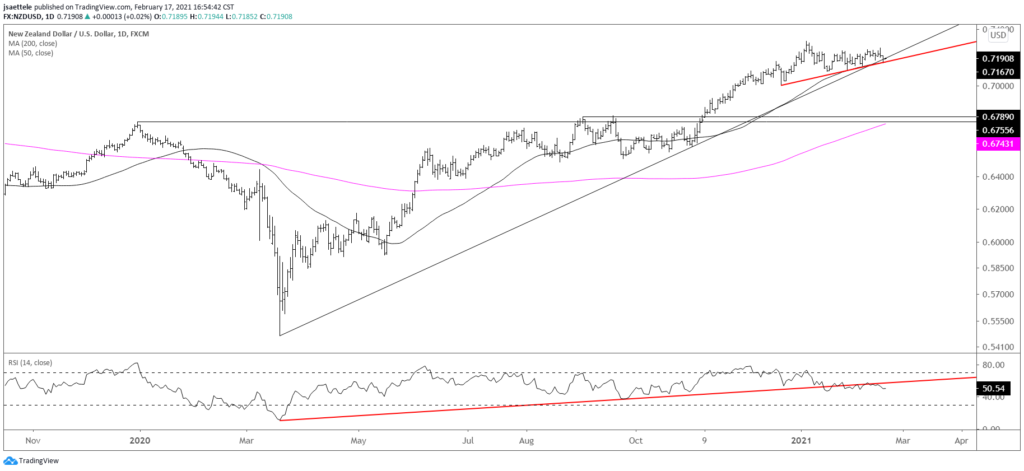
NZDUSD is sitting at the confluence of the trendline from the March low and a ‘neckline’ that originates at the 12/21 low. A break here would indicate an important change in behavior and shift focus to .6750/90. This zone is defined by former highs. The 200 day average is currently just below that zone. This NZDUSD chart best ‘illustrates’ my view on the ‘inflation trade’ now and moving forward. That is, a sharp pullback is due in order to reset (people need to question the narrative) the market before the next leg up (aka next leg down in the USD).
EURJPY DAILY
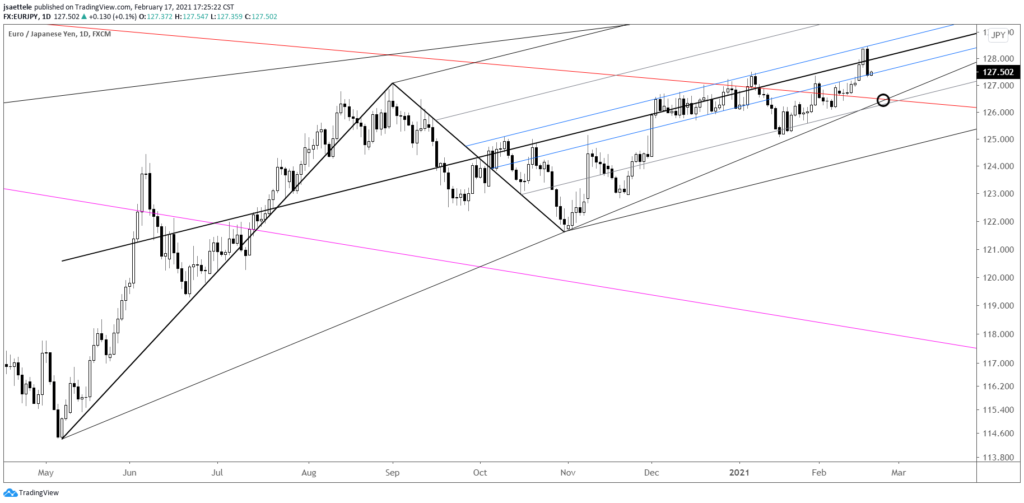
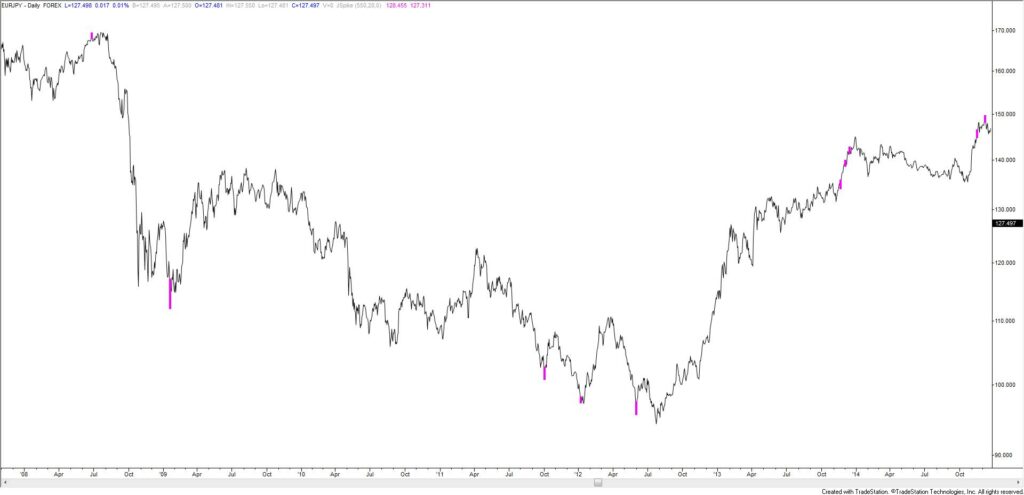
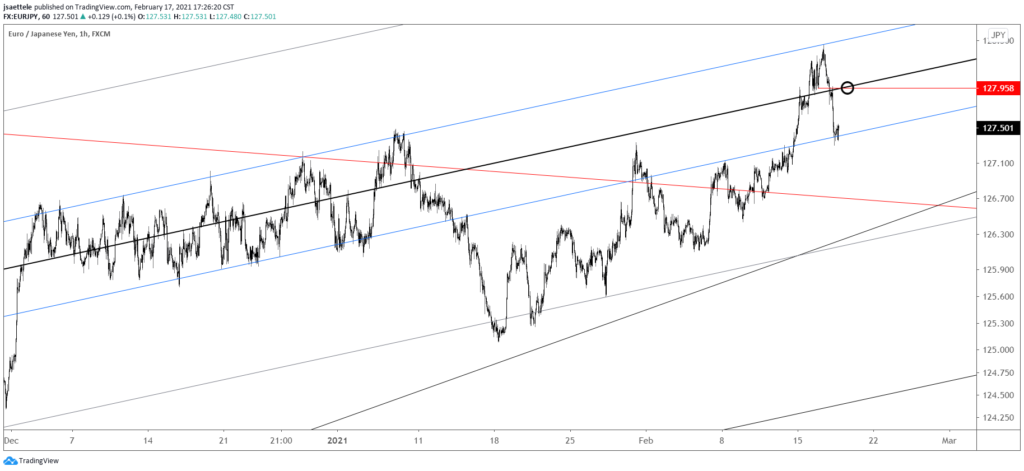
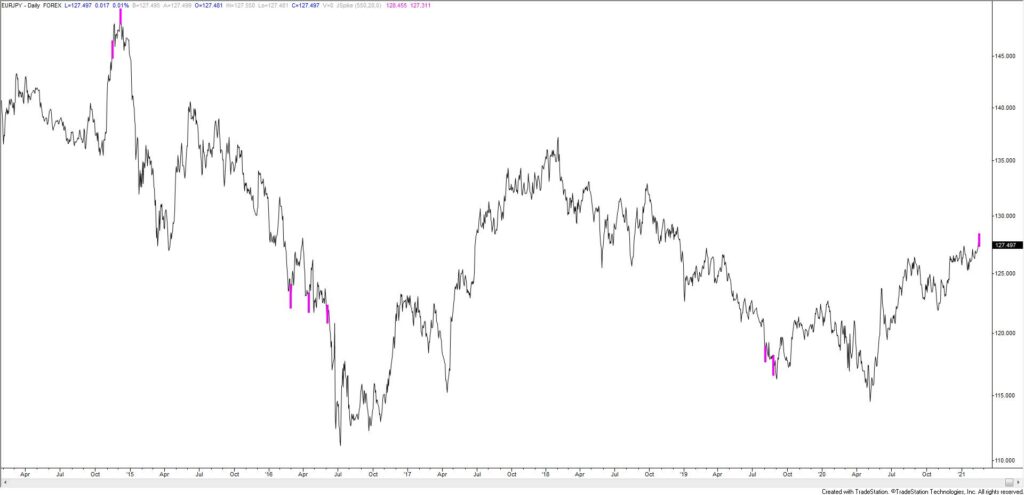
EURJPY reversed sharply today from its best level since December 2018. Pivots are occurring on parallels within the Schiff fork off of the May low. Proposed resistance is 127.95 and near term downside focus is near 126.50. A close up view is below. Also, J-Spikes at 2 year highs since 2008 are shown on charts below. The record is mixed but there have been some major turns identified by the indicator.
EURJPY HOURLY
EURJPY DAILY
EURJPY DAILY
