Market Update: February 21
CRUDE OIL FUTURES WEEKLY
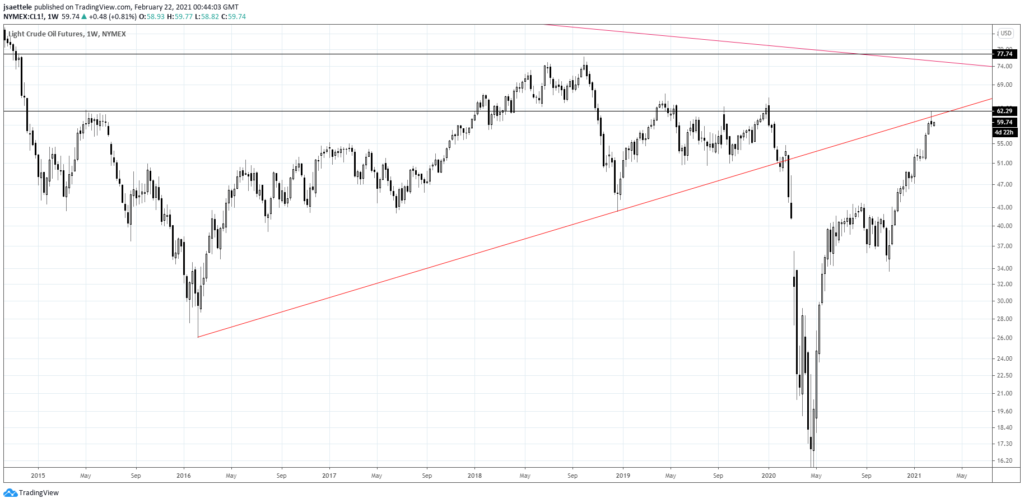
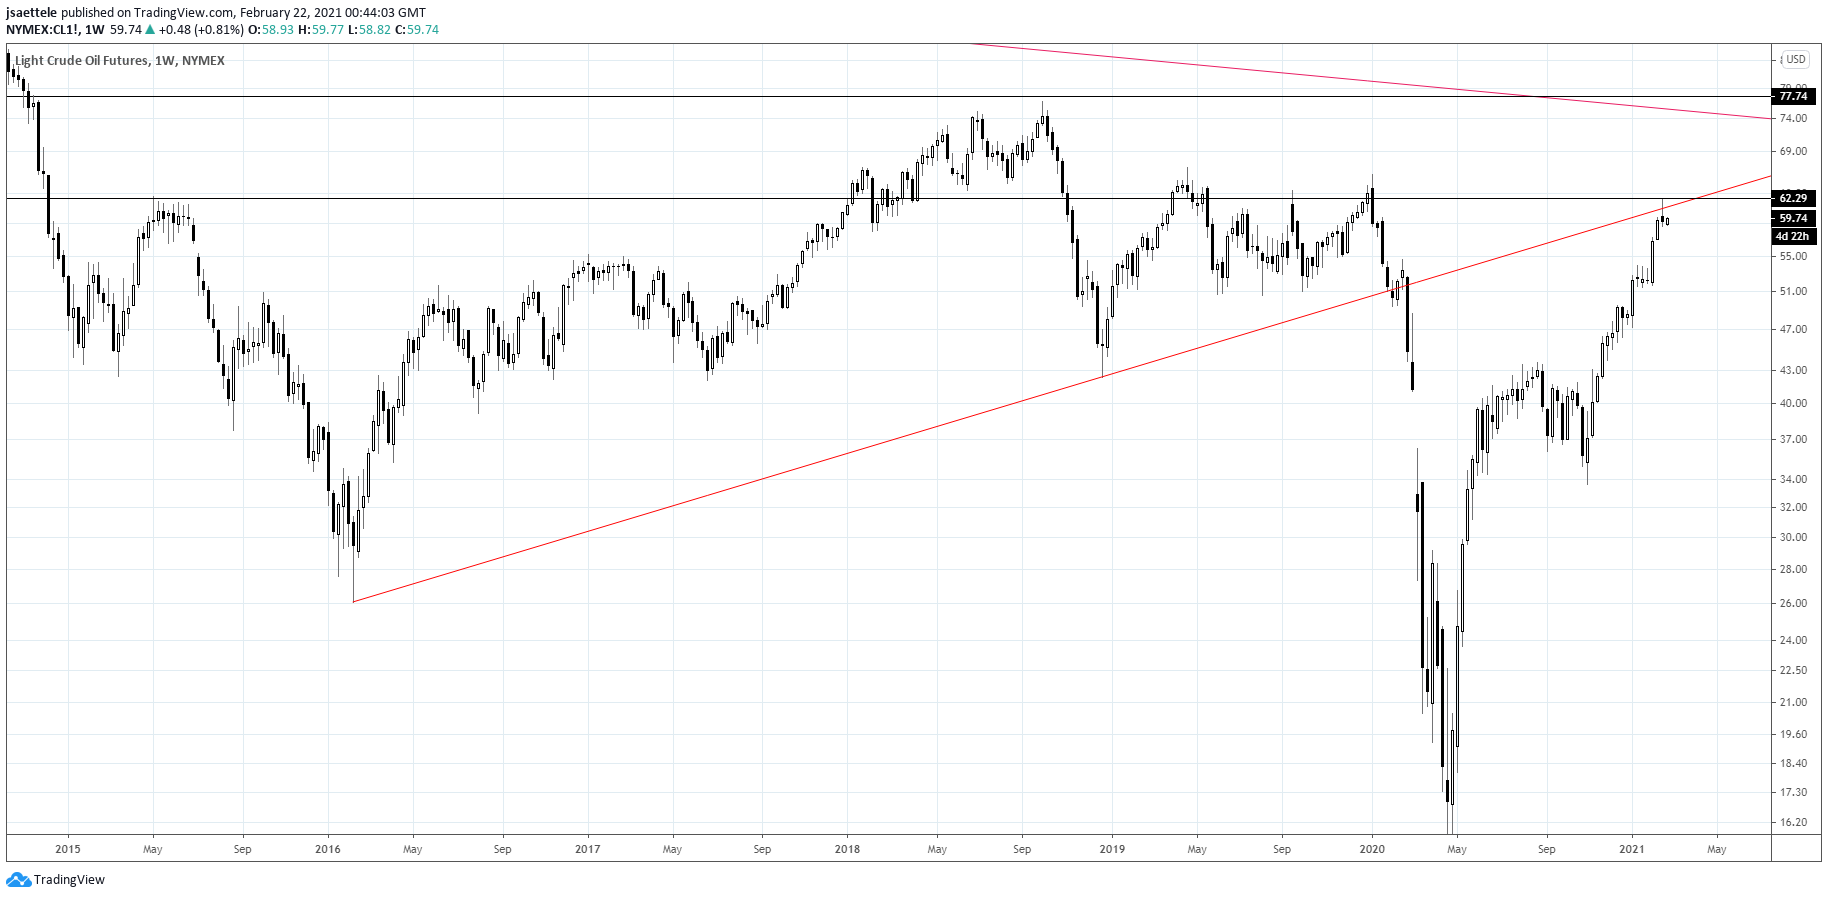
Crude made a weekly key reversal last week at a defined level (underside of the trendline off of the 2016 and 2018 lows). This is also the level that provided resistance in 2015 before the plunge into the early 2016 low. The trend in the inflation trade (basically USD down) is strong but crude could come off from the current level.
2/18 – USO made a volume reversal today. Volume reversals over the last few years have been spot on. Time to go the other way? Recall that crude futures have traded into the underside of the line off of the 2016 and 2018 lows and daily RSI is extreme (see previous RSI extremes in the 2/15 post). The futures chart is below.
EURUSD 4 HOUR
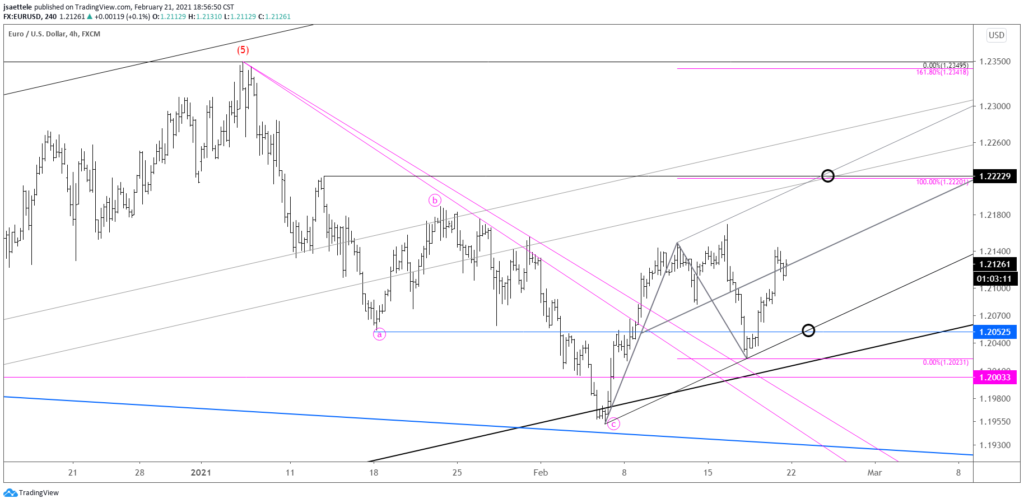
Not much change to EURUSD. Near term focus remains on 1.2220, which would be 2 equal legs up from the February low. If price pulls back from nearby then watch for support from the line off of the 2/5 and 2/17 lows. That line is currently about 1.2050.
2/18 – The flat correction in EURUSD described earlier this week appears complete at 1.2023 and trading focus is on buying the next dip near 1.2060. 1.2108 is a high volume level and possible resistance on Friday. The decline from the January high is in 3 waves but a more drawn out corrective process seems likely given that that the 5 wave rally from March 2020 took over 9 months.
GBPUSD WEEKLY
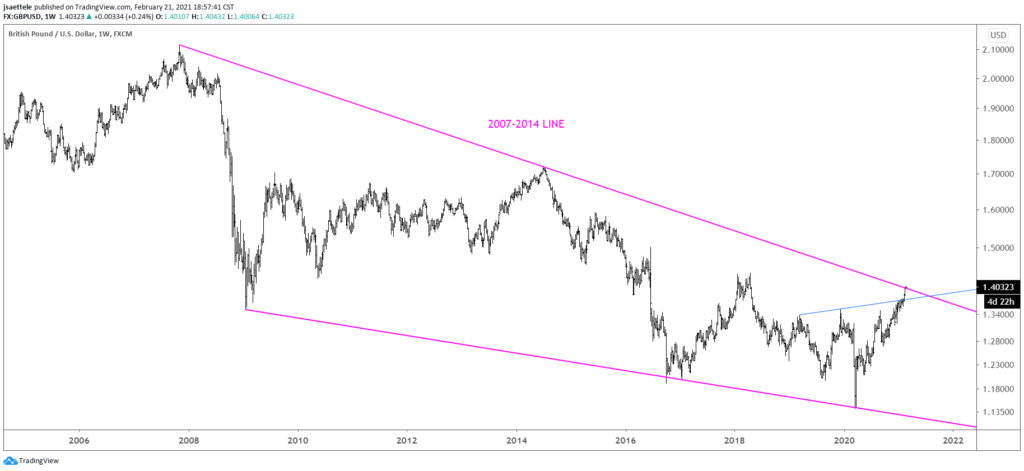
GBPUSD has reached and slightly surpassed the massive 1.4000 level. If price breaks through here then there is nothing until the 2018 high at 1.4377. Given the significance of the current level, I ‘favor’ a pullback with support near the blue line. That line is about 1.3750 this week.
2/18 – Cable is pips away from the HUGE 1.4000. I’m watching closely for evidence of capitulation (notably volume on futures). Also, GBP futures have reached VWAP from the 2014 high (see below chart). Price turned down after trading through the line in 2015 and 2018 although the VWAP line was not precise as resistance. Bottom line, pay attention up here!
USDMXN DAILY
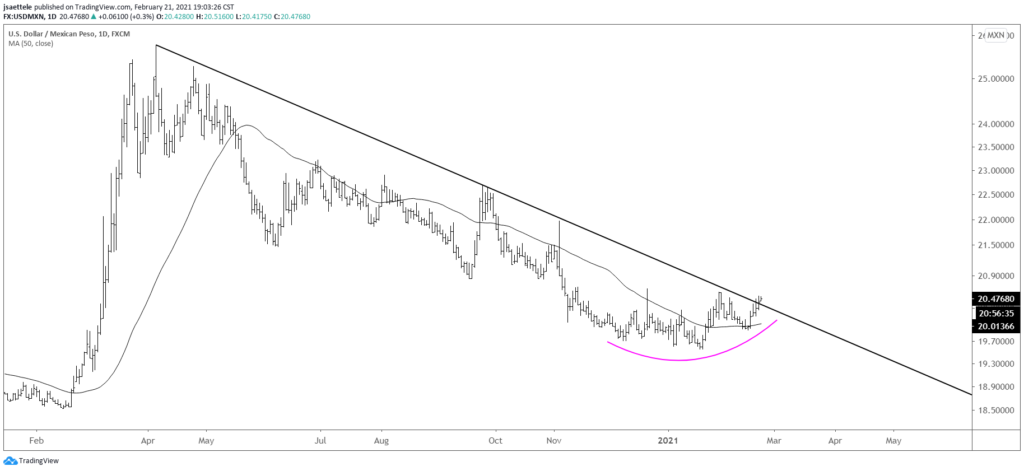
USDMXN sports a possible head and shoulders bottom pattern since early December and is testing the trendline that originates at the March high. This is interesting since the USD has been tanking nearly everywhere else. A break above 20.67 would complete the pattern and shift focus to former support from the June low at 21.46.

