Market Update 4/15 – Key Support for the USD
S&P 500 FUTURES (ES) DAILY
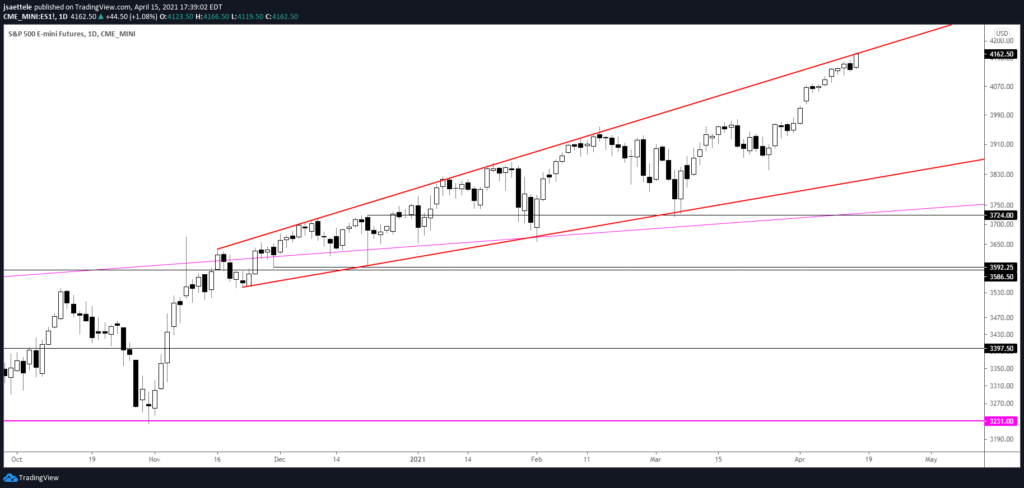
ES has reached the line that we’ve been waiting for. In fact, price closed the day right at the line. It’s tempting to short here but we need ‘something’ to suggest that a top is in place. A key reversal (or high volume reversal) would be ideal. Wait and see.
4/13 – The line that extends off of highs since November is about 4155 now. KNOW IT. The Goldman risk appetite index just printed a record high (see below). ‘But protection when you can, not when you have to’ goes the saying.
TLT DAILY
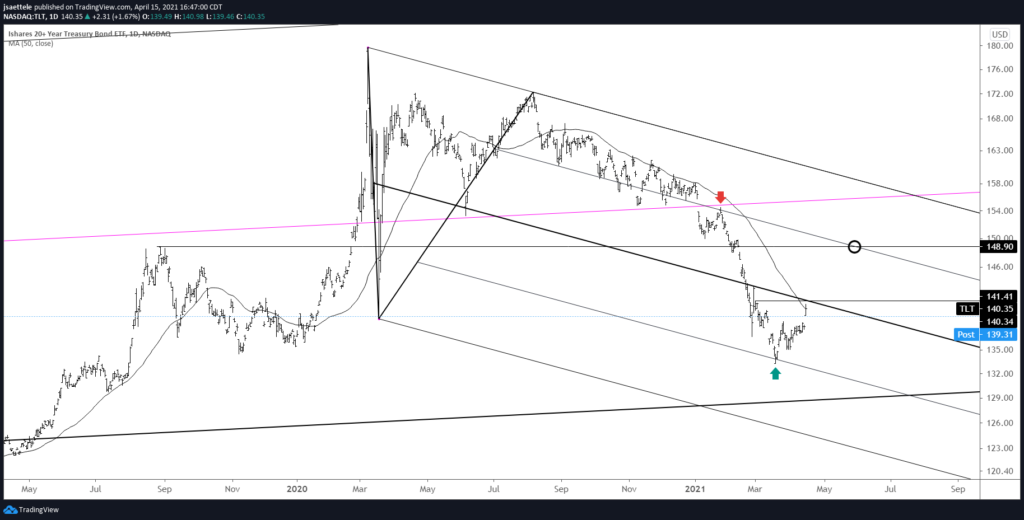
TLT has reached initial resistance from the median line and 50 day average. I remain constructive towards 148.90 but some back and fill and/or a pullback here wouldn’t be a surprise. If price breaks above the median line, then the top side of that line becomes proposed support.
4/8 – I maintain that TLT action since late February is a bottoming process. Note the arrows at the 25 and 75 lines of within the channel from the March 2020 high. This is a perfect example of median line symmetry. That is, an important reaction at the 25 line is often followed by a reaction at the 75 line and vice versa. Near term focus is higher towards 141.40. A break above there opens up 148.90.
COPPER FUTURES (HG) DAILY
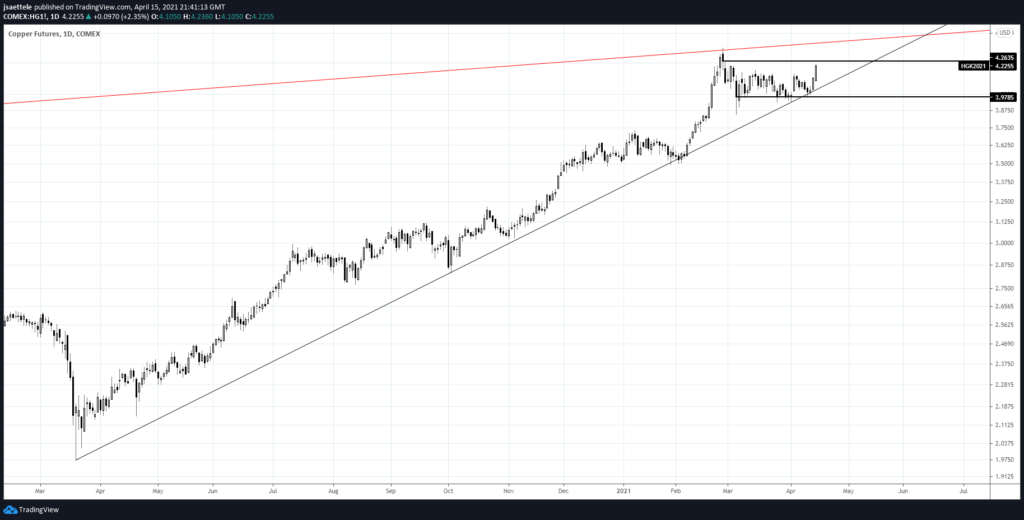
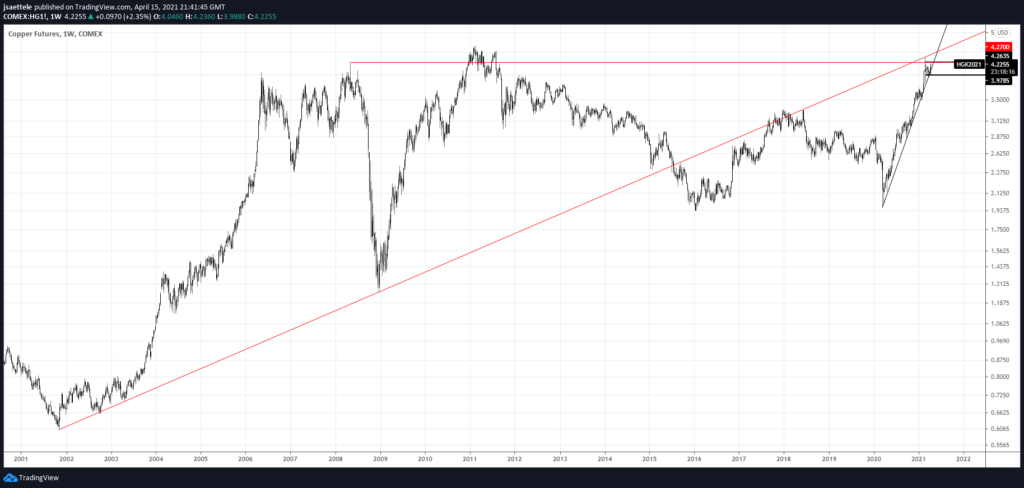
Pay attention to 4.2635 in copper. This is daily reversal resistance (close of the high day). In fact, notice how the close of the low day (3/4) was support (we call this daily reversal support). Again, the February high was at long term resistance so I ‘favor’ resistance holding (see long term chart below).
4/12 – Copper is once again testing the critical trendline from the March 2020 low. This line is reinforced by the 50 day average, which has been precise support since November. I’m waiting for a break lower in order to turn bearish copper.
COPPER FUTURES (HG) WEEKLY
GBPUSD 4 HOUR
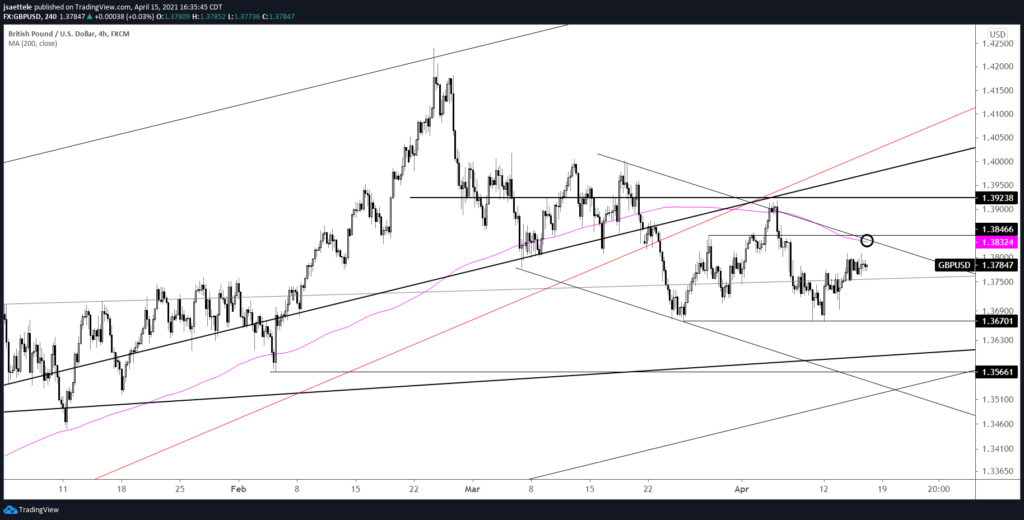
Proposed resistance in GBPUSD now is 1.3830s. I’ll consider flipping from bull to bear if that level provides resistance.
4/15 – The spike lower and reversal during early U.S. trading keeps yesterday’s ‘idea’ intact. That is, a bounce into 1.3850 or so is in order before GBPUSD resumes lower.
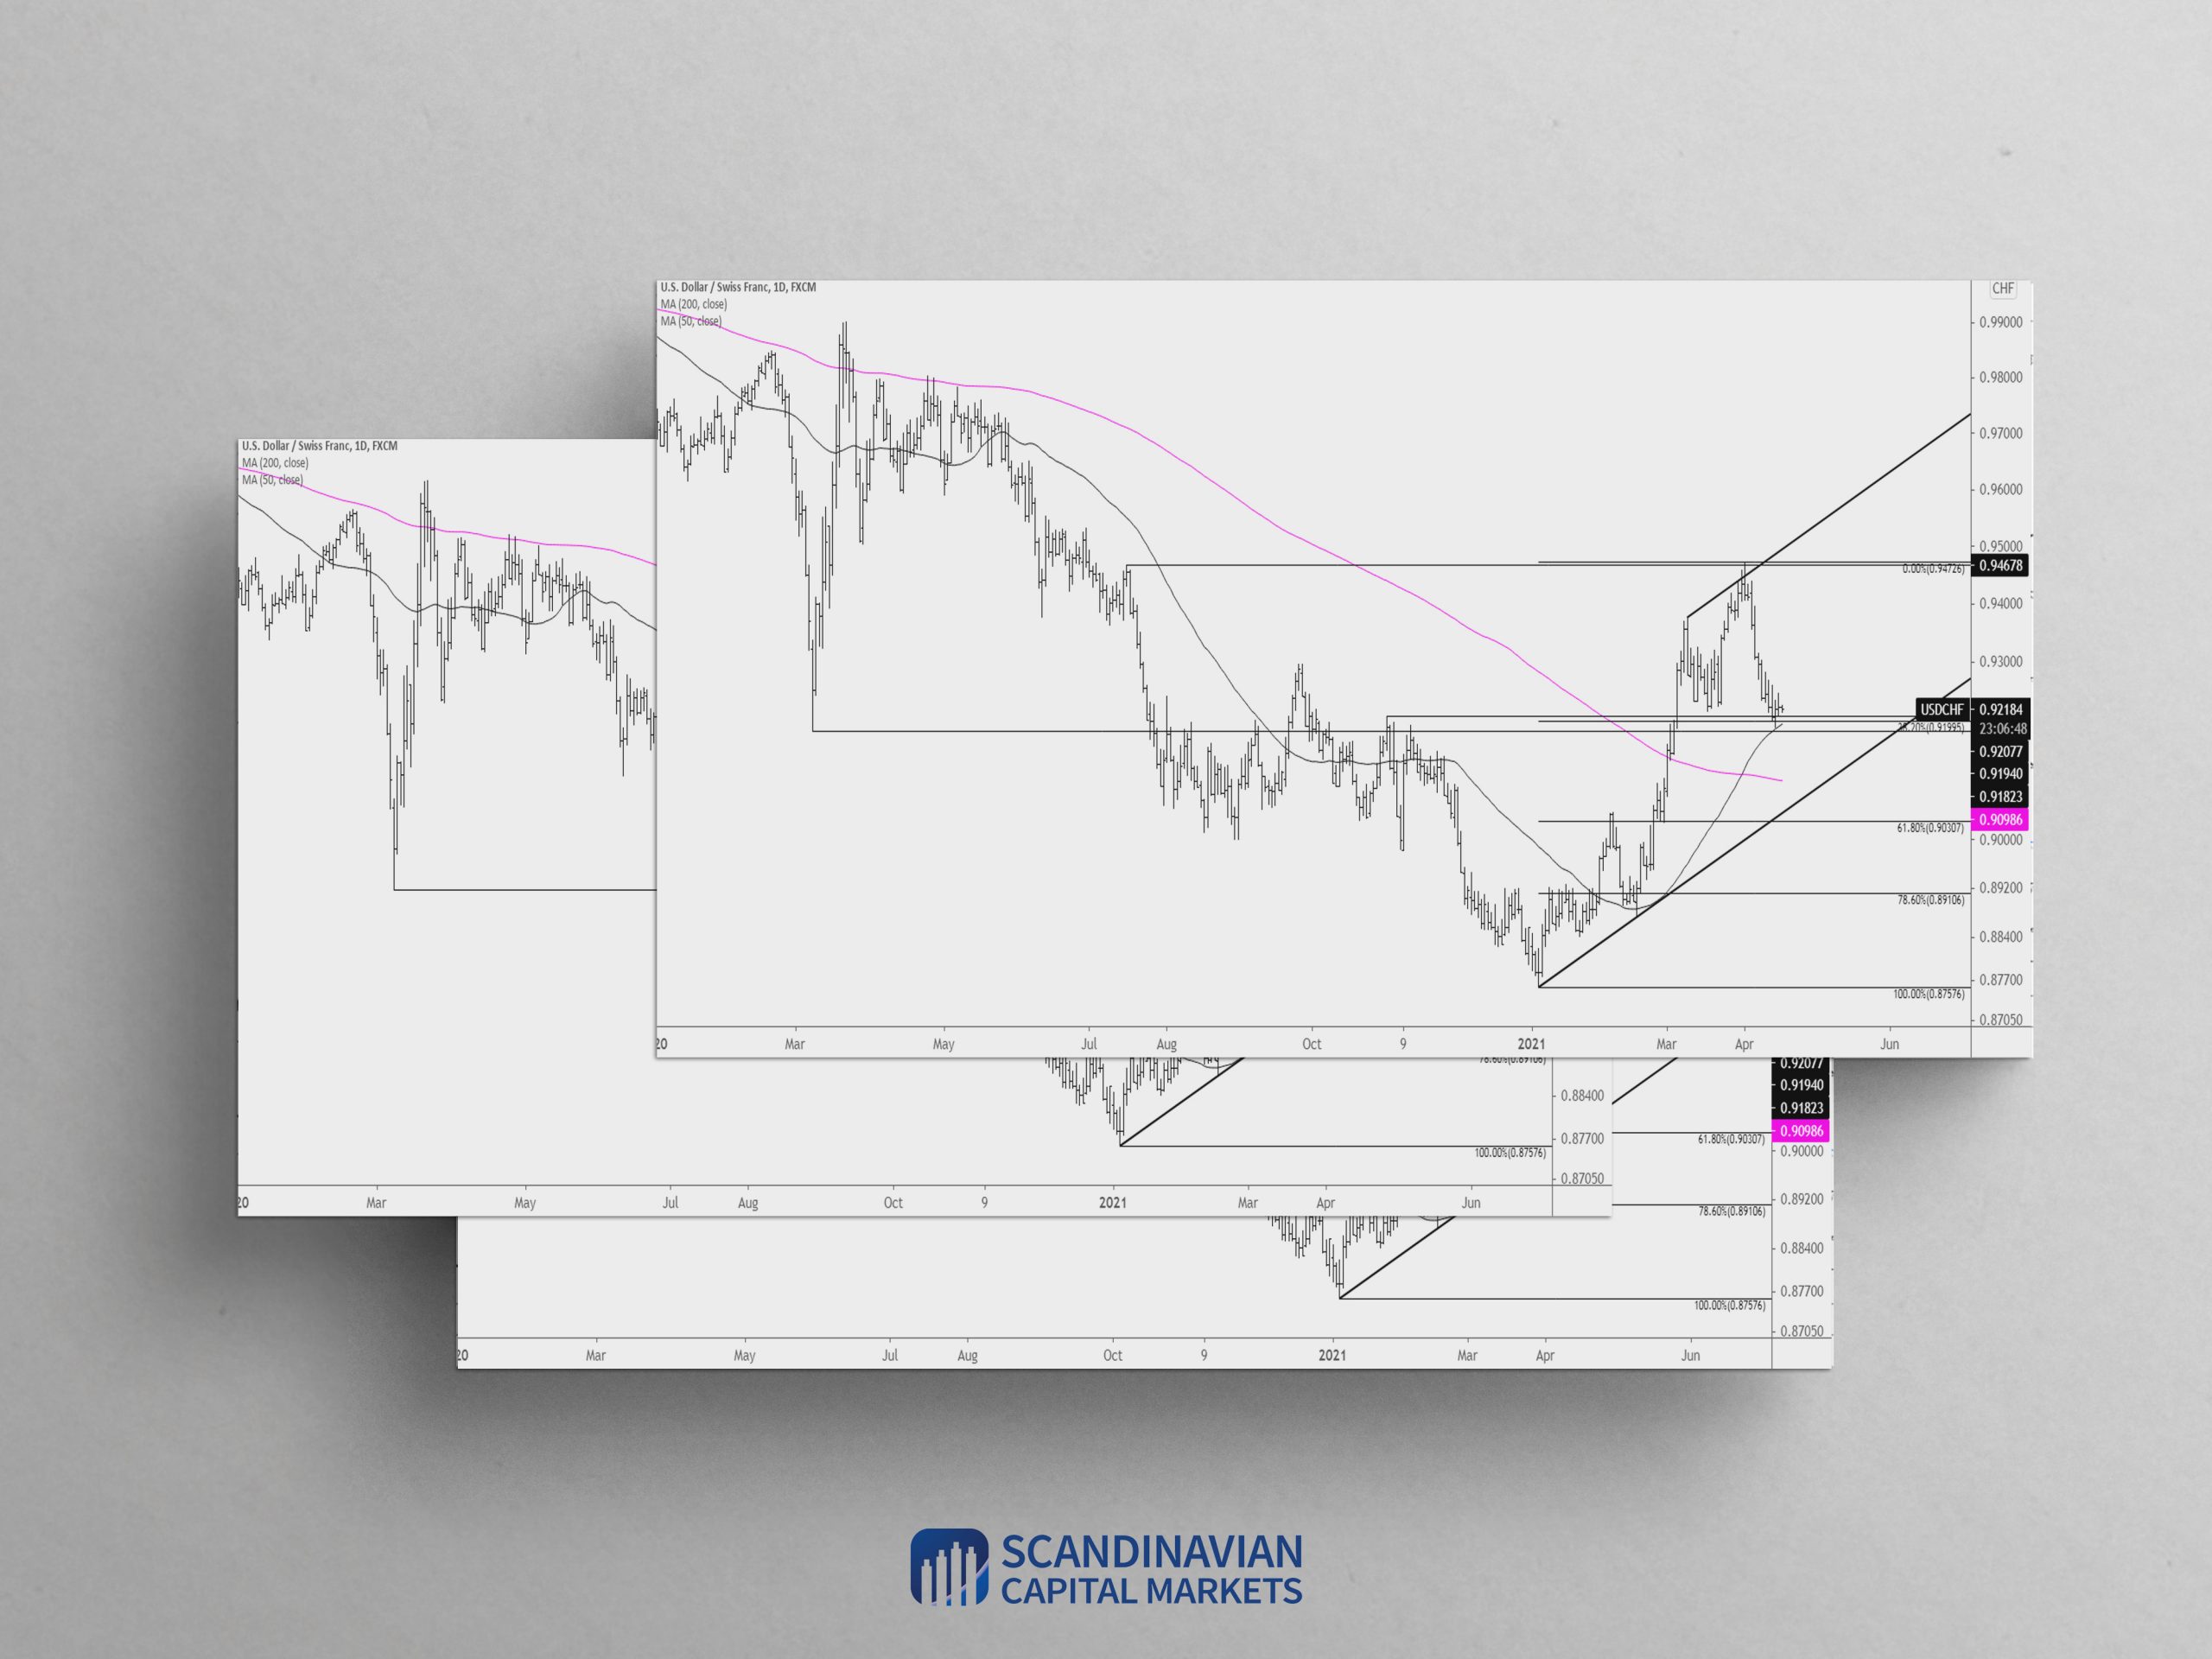
USDCHF DAILY
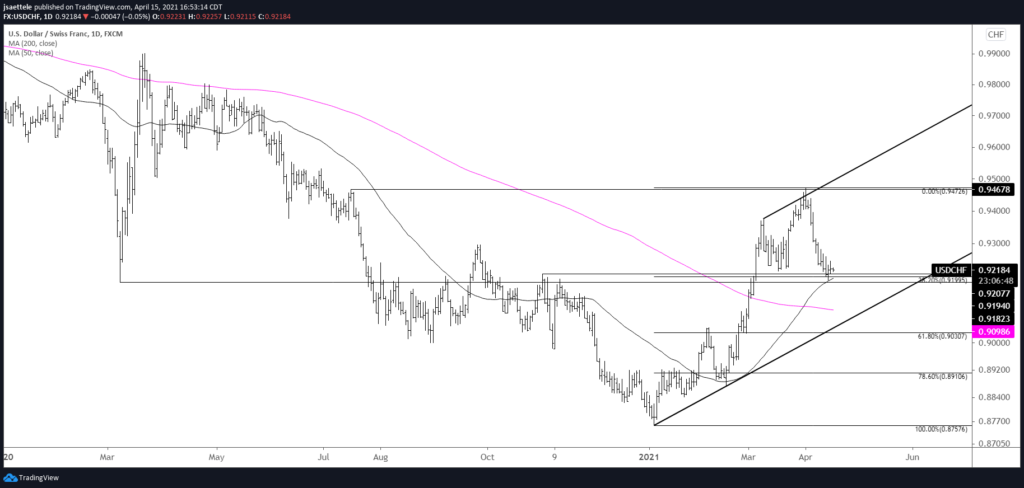
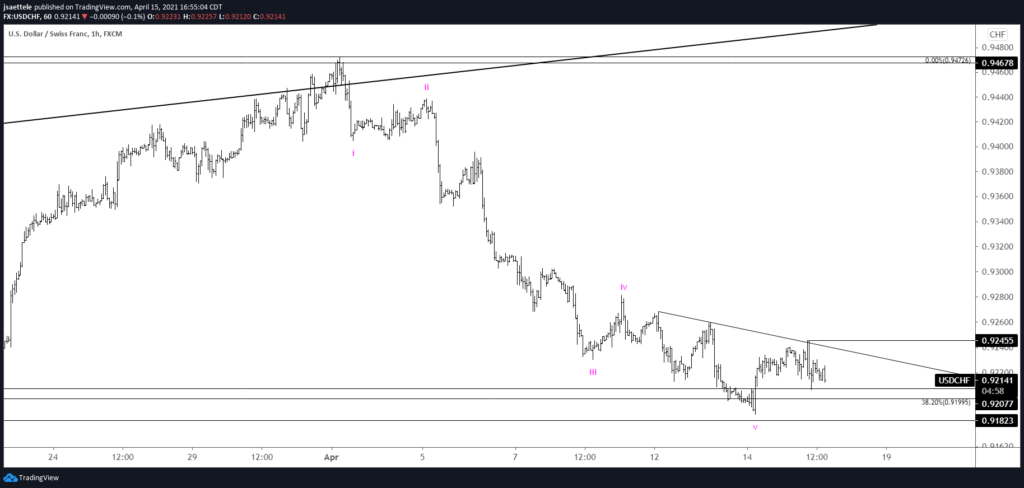
USDCHF is into support and the level is loaded. The 38.2% retrace, 50 day average, March 2020 low, and November high span ..9180-.9210. I’m looking for a turn higher. Also, the decline from the top is impulsive so a corrective rally is expected. The trigger is above .9245 (see below).
4/1 – This USDCHF chart is a perfect example of parallel channeling with original slope. Another example is the longer term USDTRY chart later in this post. Simply draw a line off of the first 2 pivots (lows in this case). Then extend a parallel from the extreme pivot on the other side (a high in this case). This parallel estimates resistance.
USDCHF HOURLY
USDJPY 4 HOUR
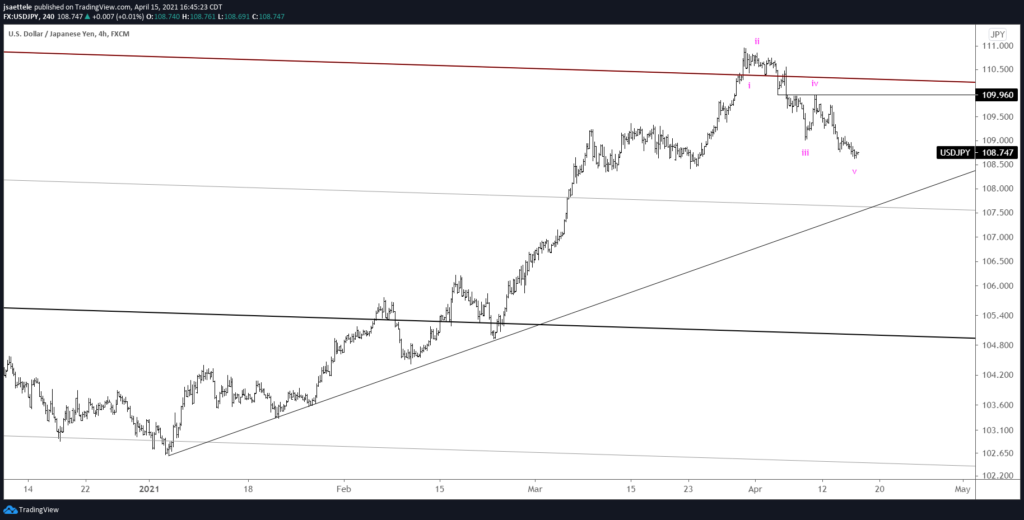
The USDJPY decline is in 5 waves although there is not a well-defined level until the 3/23 low at 108.41. Maybe that needs to be tested before price can bounce but 5 waves down suggests that the drop is long in the tooth and that a bounce is due. 110.00ish is still proposed resistance.
4/18 – The poke above the 2018-2020 line was short lived as USDJPY has reversed all of last week’s gains. The failed break above this line makes for a bearish setup. Near term, watch for a bounce near 108.80 and for resistance near 109.85-110.00 (see 4 hour chart below). I favor shorts into the proposed resistance zone.
USDCAD 4 HOUR
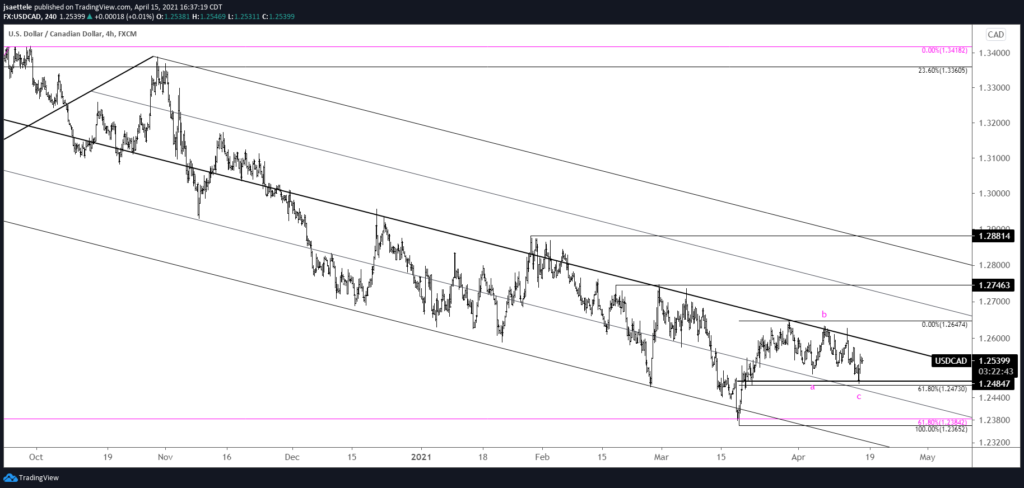
USDCAD finally tested daily reversal support today at 1.2485. Price also put in a key reversal. The drop from 3/30 is in 3 waves and consists of 2 equal legs. The implication is that weakness is corrective. I am looking higher against today’s low.
4/7 – USDCAD low on Monday was 1.2502, just above the noted zone for support. Price is testing resistance in the form of the median line from the Schiff fork that originates at the March 2020 high so I’d welcome a pullback to buy. The month open is proposed support at 1.2562. If price breaks above the median line, then the top side of the line becomes support. The next upside level is resistance from February near 1.2750.


