Market Update 2/15 – Watch Crude Oil Up Here!
ICE WTI CALL TRADING
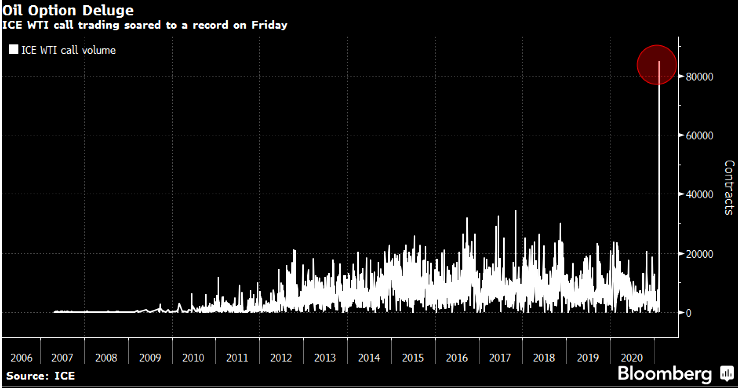
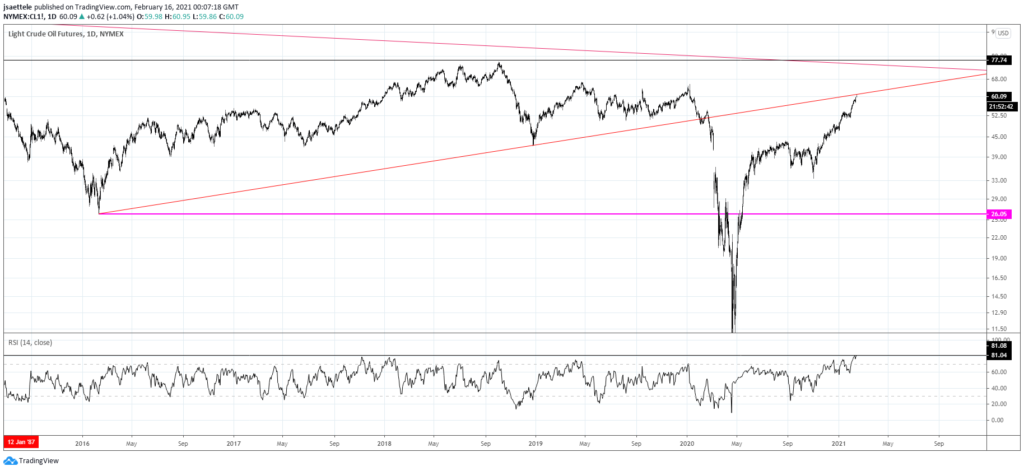
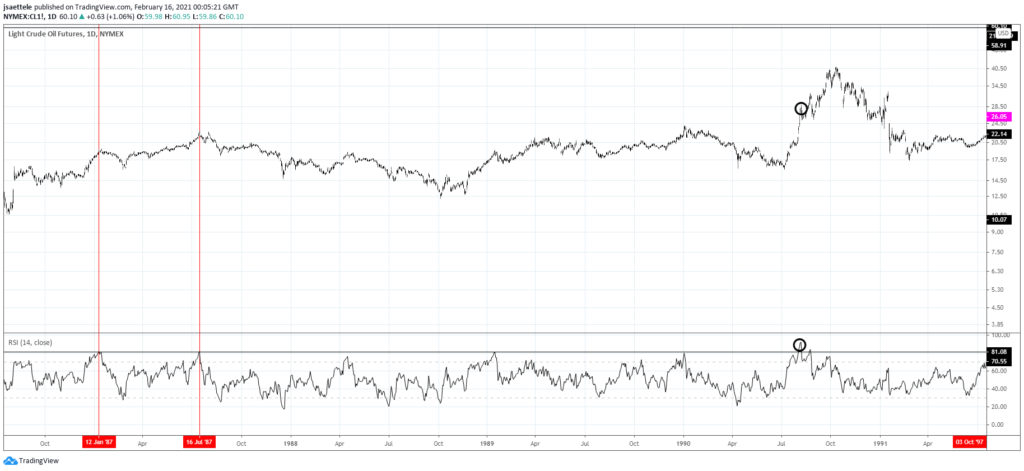
Demand for oil calls went ballistic on Friday. To say that oil call buying reached a record on Friday is an understatement. Can all those call buyers be right? Daily RSI on WTI is at 81 and price is pressing the underside of the line off of the 2016 and 2018 lows (see below). Daily RSI has only reached these heights on 4 other occasions (also shown in charts below), October 1997, August 1990 (beginning of the Gulf War…circled on the chart), July 1987 and January 1987. The only instance in that that did not coincide with a price top was the August 1990 Gulf War market.
CRUDE OIL FUTURES (WTI)
CRUDE OIL FUTURES (WTI)
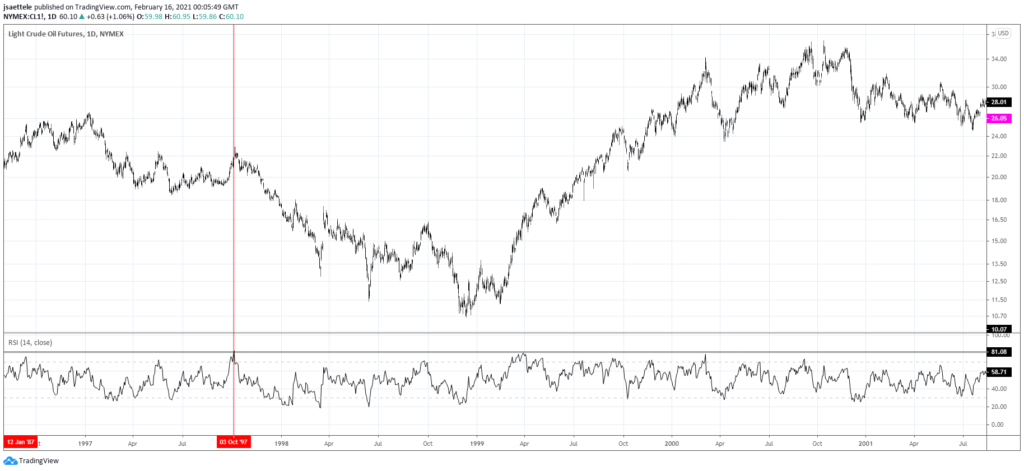
CRUDE OIL FUTURES (WTI)
SPOT SILVER (XAGUSD) HOURLY
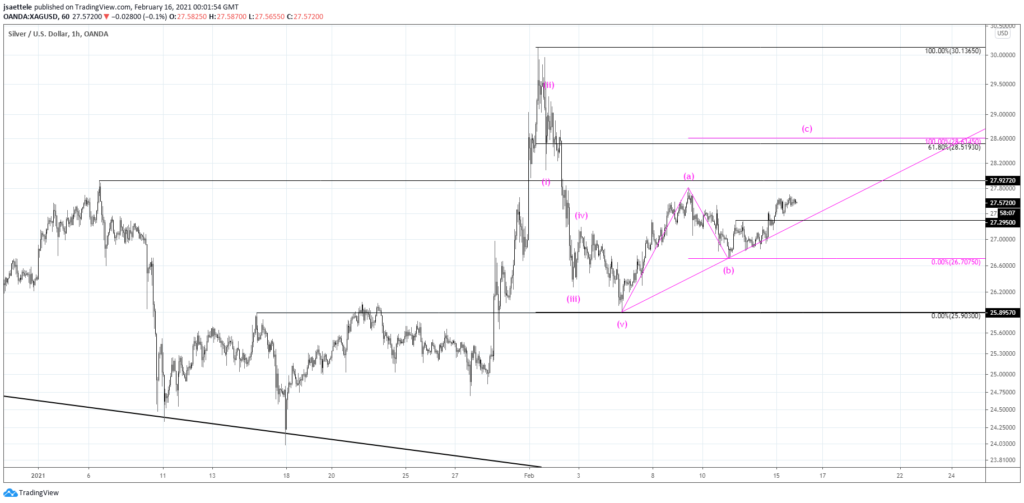
Silver is tracing out a 3 wave corrective advance. The ‘ideal’ spot for the next top is 28.52/62 (2 equal legs from the low and the 61.8% retrace). 27.30 is now proposed support.
2/7 – SLV (silver ETF) made a massive volume reversal last week. It’s ‘massive’ because volume was 3 times the average of 13 week volume. The only other instances of this occurring are late 2010 and April 2011. The late 2010 instance was a false signal. The April 2011 instance was the all-time high. Near term, the drop in spot silver (see below) is in 5 waves so expectations are for a corrective advance before weakness resumes. The proposed resistance zone is 28.00/50.
DXY WEEKLY SEASONALITY
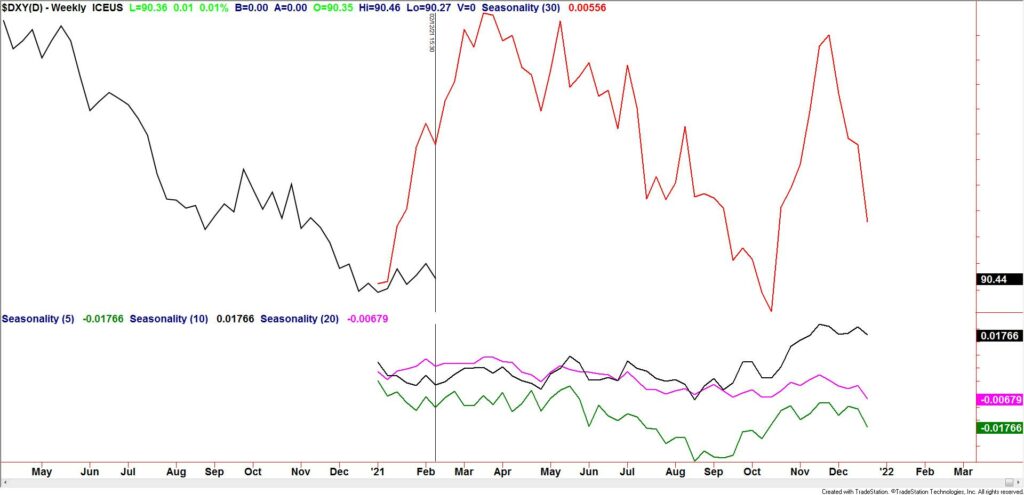
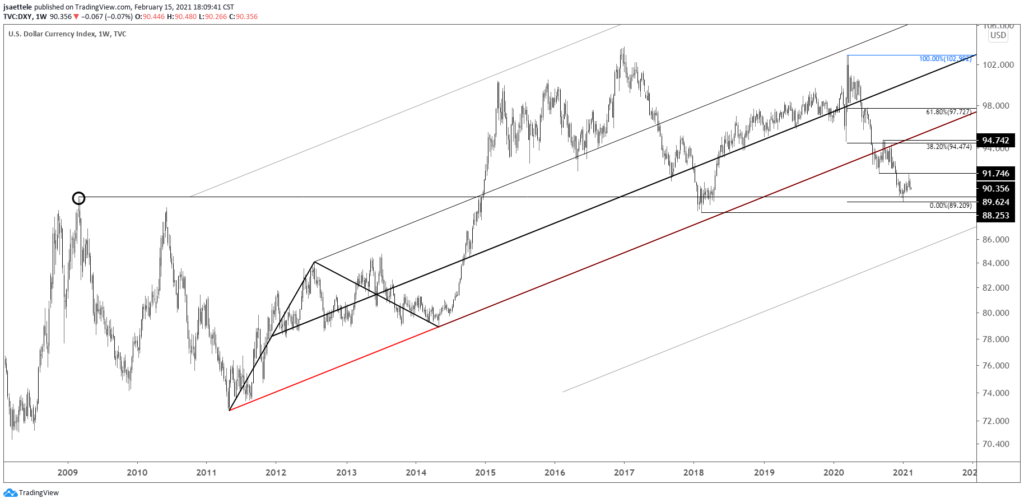
This week marks the beginning of an extremely strong seasonal period for the USD. The period extends through late March. As a reminder, DXY is consolidating above an extremely important long term level (see below). Is this a consolidation low or simply consolidation before lower prices? Seasonals and positioning suggest the former. Near term clarity is lacking…for now.
DXY WEEKLY
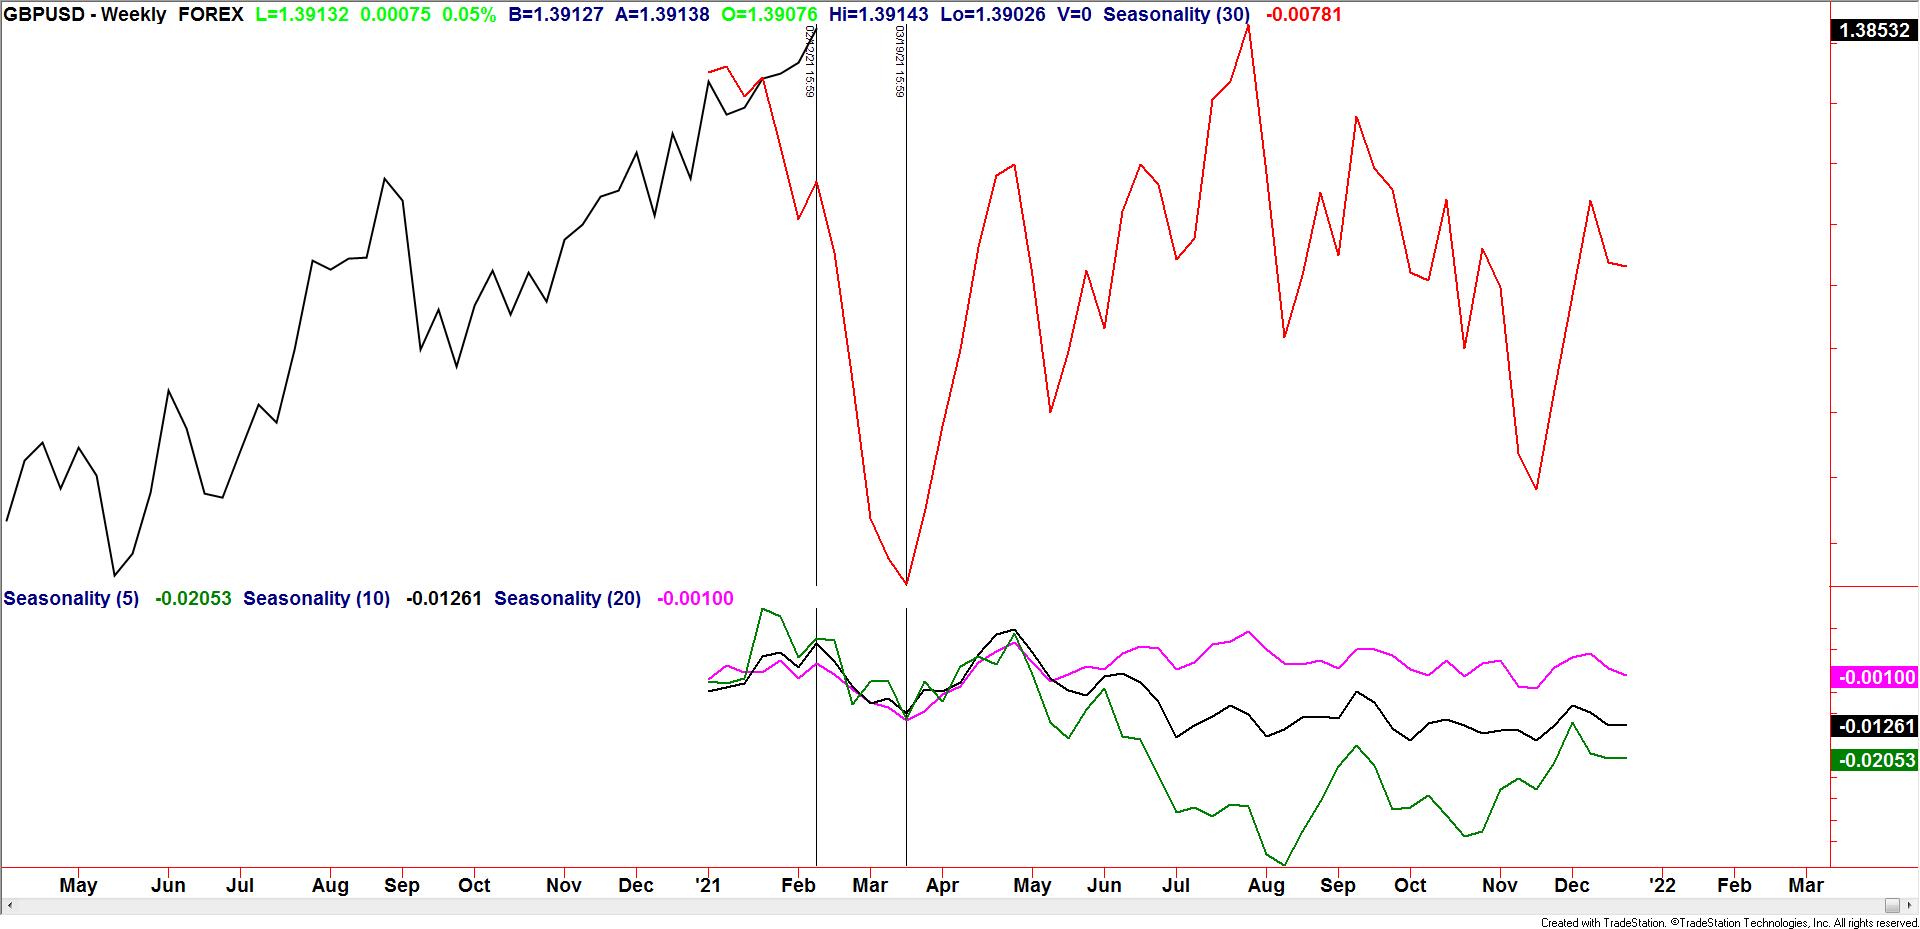
GBPUSD WEEKLY SEASONALITY
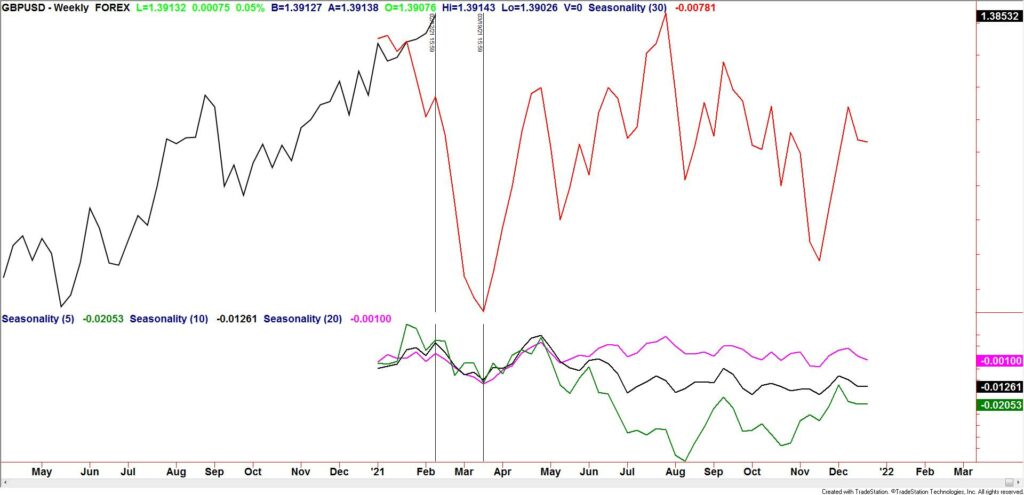
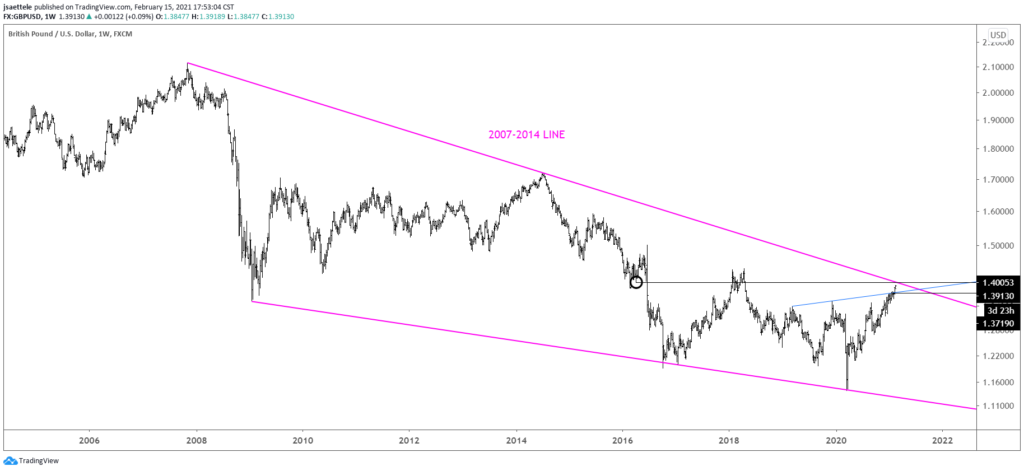
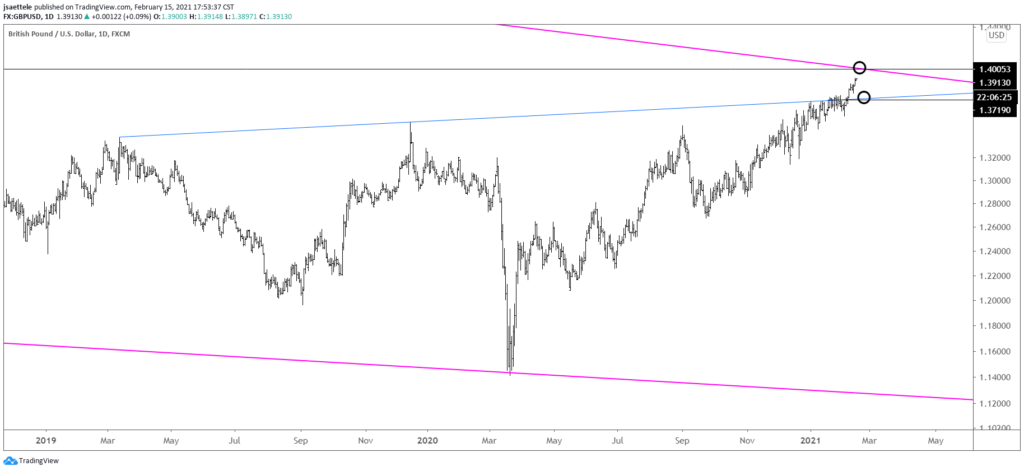
GBPUSD is nearing the critical 1.4000. The trendline off of the 2007 and 2014 highs is slightly above the BIG figure (see below). 2007…2014…2021 (7 year cycle)? Again, seasonal tendencies are extremely bearish through until the Vernal Equinox. I’m on alert for signs of a top near 1.4000.
2/9 – Cable is closing in on 1.4000, which is not only important from a psychological perspective but is also the line off of the 2007 and 2014 highs. If price pulls back before reaching 1.4000, then watch for support near 1.3720. 1.3720 is the top side of the line that connects highs since March 2019 (previously resistance so watch for the line to provide support).
GBPUSD WEEKLY
GBPUSD DAILY
AUDUSD WEEKLY SEASONALITY
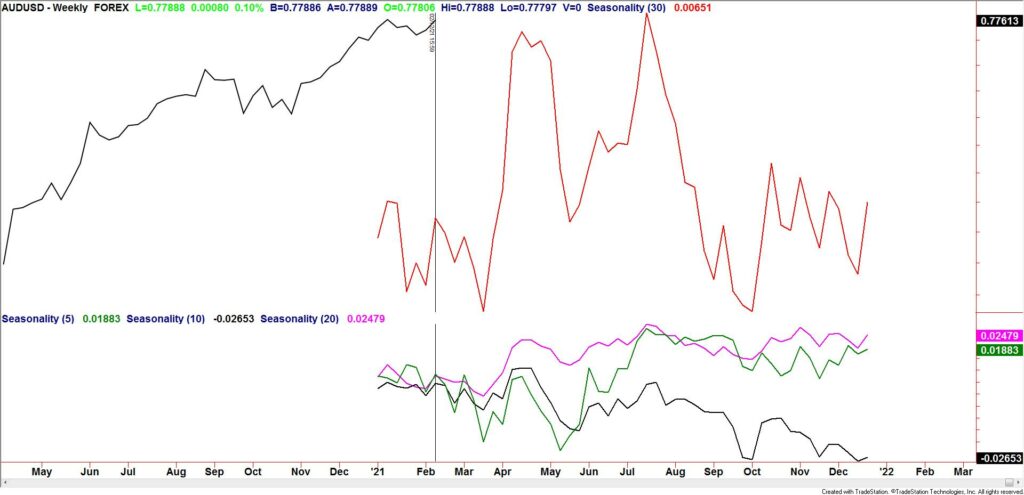
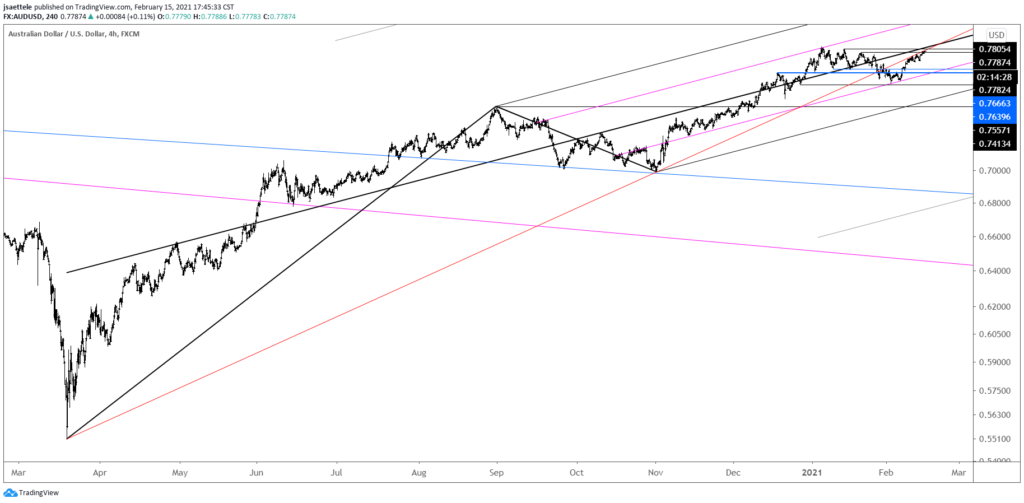
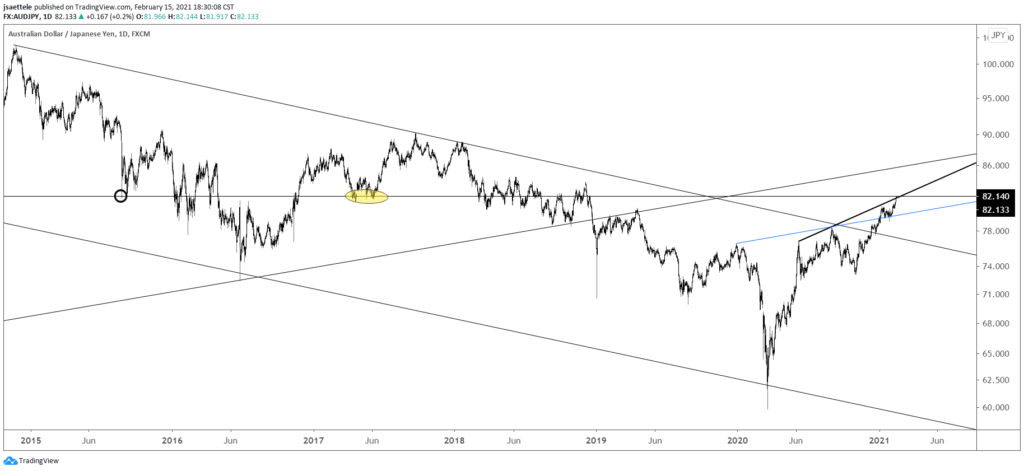
Yes, AUDUSD seasonal tendencies are also extremely bearish now. Price continues to press against the underside of the line that originates at the March low. AUDJPY may be more interesting though for a reversal. Price is pressing against a significant horizontal level (see 2 charts down) and the line off of the June and August highs. If we do get reversal evidence, then downside focus would be the line off of the December 2019 and August highs near 79.90.
AUDUSD 4 HOUR
AUDJPY DAILY
EURUSD HOURLY
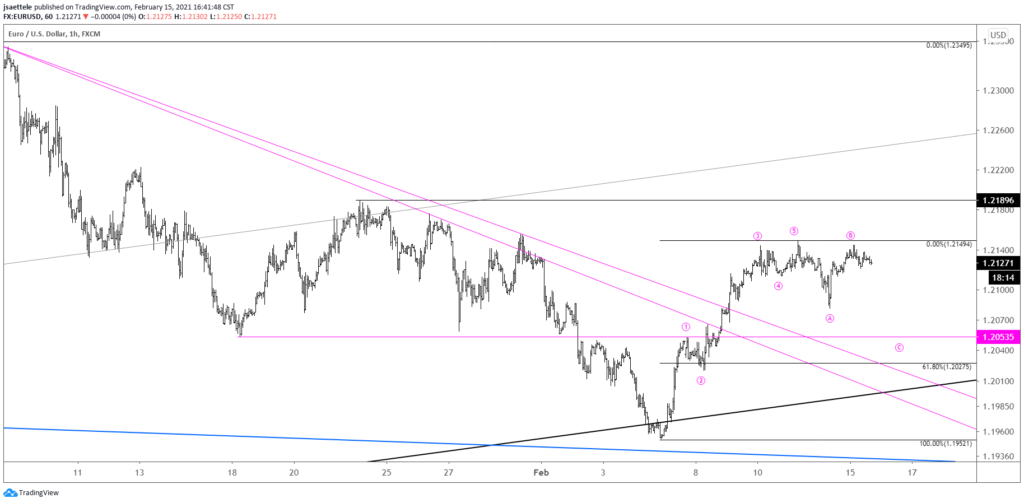
A flat may be unfolding in EURUSD from the 2/11 high. The implication is that price turns down now or after a spike through 1.2149 and then drops under 1.2082 (end of wave A) in order to complete the 3 wave correction.
2/11 – EURUSD traded up to 1.2149 today so a near term top may be in place. The rally consist of 5 waves so expectations are for a drop and then another leg higher. My ‘guess’ is that a prolonged range is underway from the January high. Markets oscillate between trending and ranging periods and EURUSD has been trending higher since March 2020. A reset of sorts is needed in the form of a range. For now, pay attention to 1.2030/50 for support.

