Market Update 7/7 – EURUSD Testing Key Level
TLT DAILY
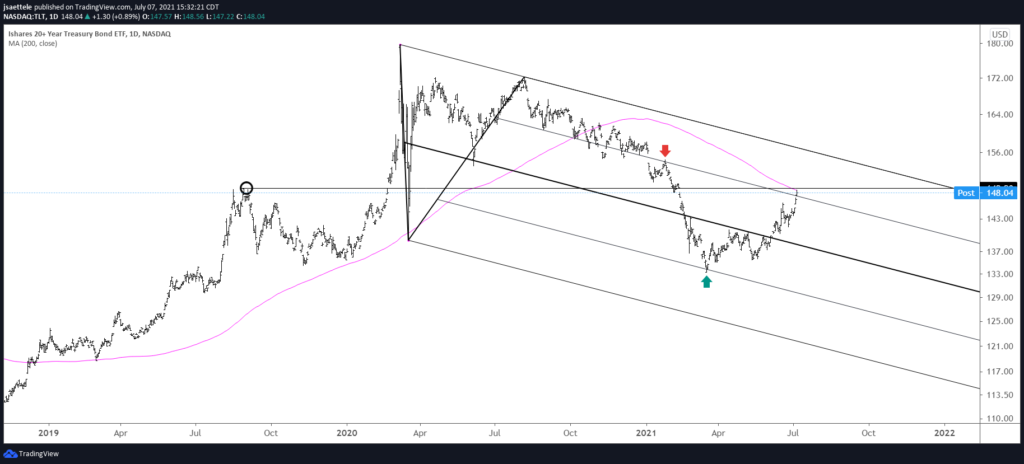
Time to short bonds again? Maybe. The level outlined for resistance one month ago has been reached (high today was 148.56). There is a lot here, including the 200 day average and 2019 high. I am ‘thinking’ reversal lower from here.
6/8 – TLT gapped higher through the median line today. This is typical price behavior around a median line. Focus is higher towards 148.90 (give or take). Remember, higher TLT means lower rates. This can (not always) correlate with risk aversion and lower Yen crosses in FX.
SPOT GOLD 4 HOUR
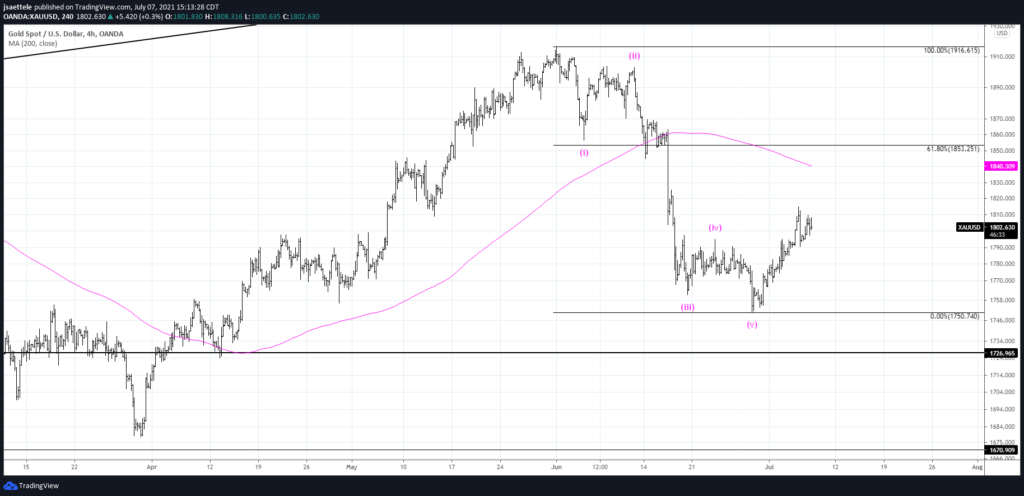
My view is that the rally from 6/29 in gold is countertrend. The decline from 6/1 is impulsive (5 waves) therefore strength should unfold in a corrective manner. Wave A of the rally is probably close to complete so expect a small pullback before another leg up to test the 61.8% retrace of the larger decline at 1853.
EURO FUTURES DAILY
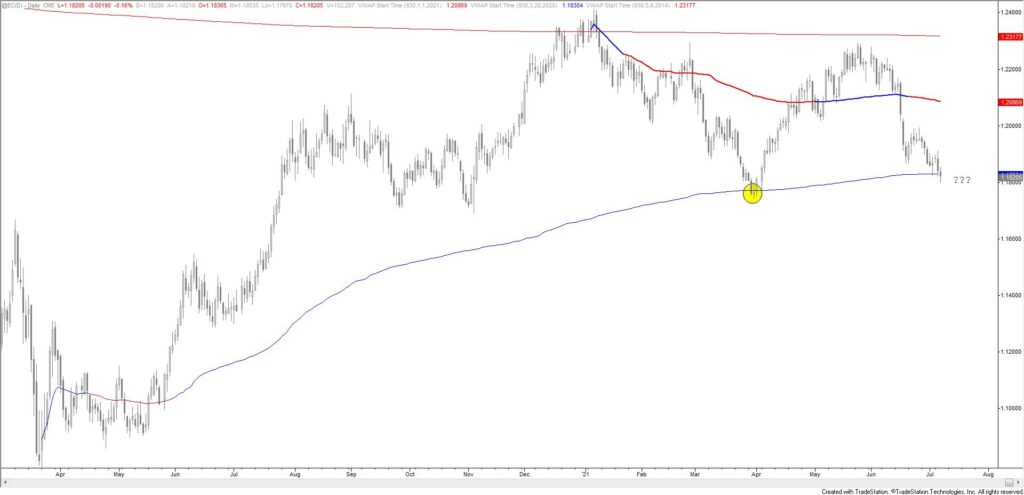
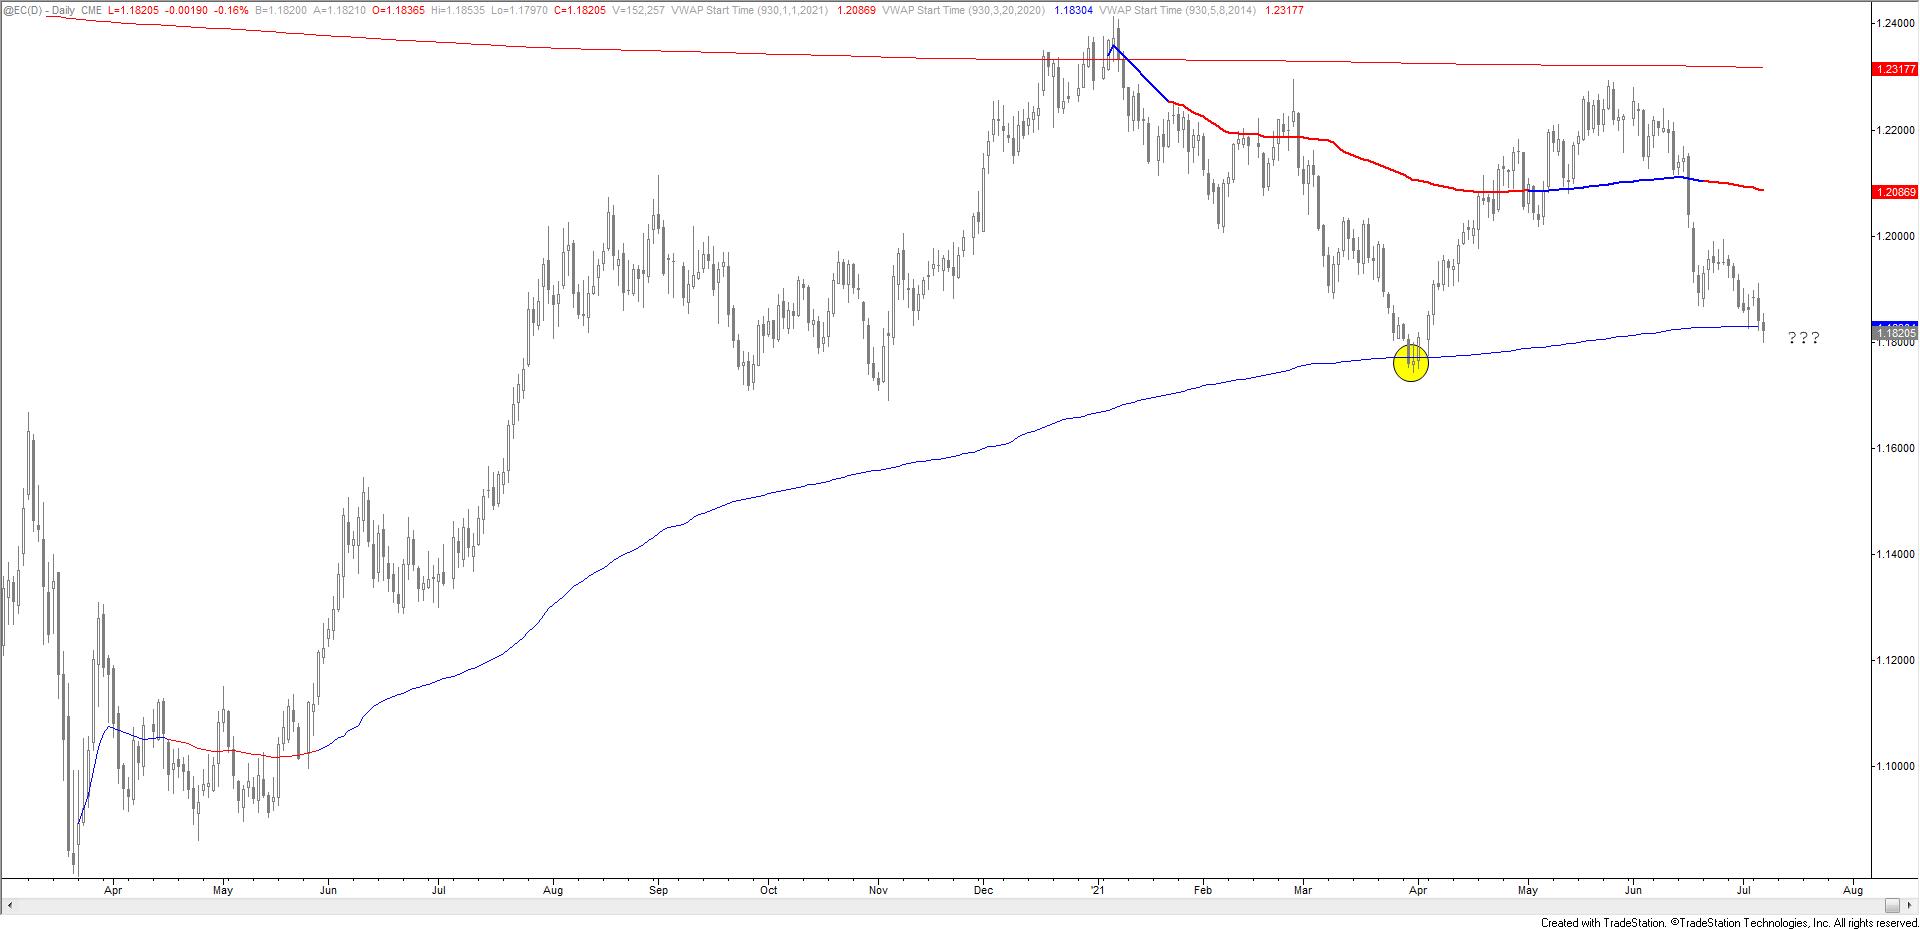
FOMC minutes were today and the ECB version is tomorrow. Price is just pips from the noted 1.1770 level (remember that’s a possible bounce level). Price is currently at VWAP from the 2020 low, which was support for the March low. Bottom line, EURUSD is into a zone that could lead to a strong bounce. If reversal evidence arises, then I’ll let you know and look to take action.
6/30 – EURUSD is in the exact opposite position as DXY. That is, the line that extends off of the September and March lows intersects the median line from the fork that originates at the January high. That intersection is about 1.1770. A break below there would be extremely bearish. The red parallel (25 line) is now resistance. That line is currently about 1.1950 about 6 pips per day.
USDJPY 4 HOUR
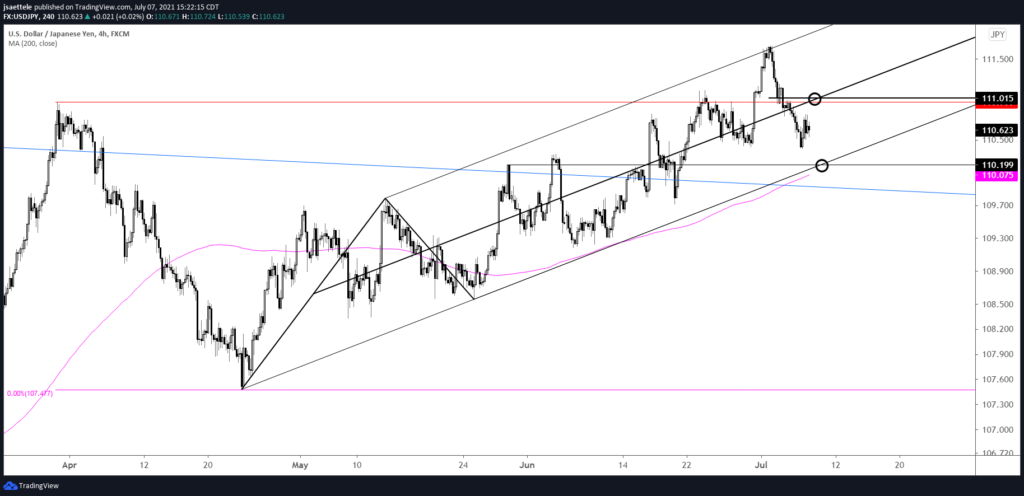
USDJPY failed to sustain strength and put in a strong reversal day on 7/2. The failed breakout leaves USDJPY vulnerable to forming a bigger top. Watch channel support near 110.20 for a bounce or break. 111.00ish is now proposed resistance for a lower high.
7/1 – USDJPY has broken out of the wedge so it’s worth taking a shot on the long side. The topside of the wedge is now proposed support near 111.20. If this is going to work, then price shouldn’t drop much under the former high of 110.97. The February 2020 high is a possible reaction level at 112.23 but general upside focus is 115.52/85, which is the 61.8% retrace of the decline from the 2015 high and 2 equal legs up from the January low. A longer term chart is below.

