Market Update 4/21 – Longer Term Dow Trend Change?
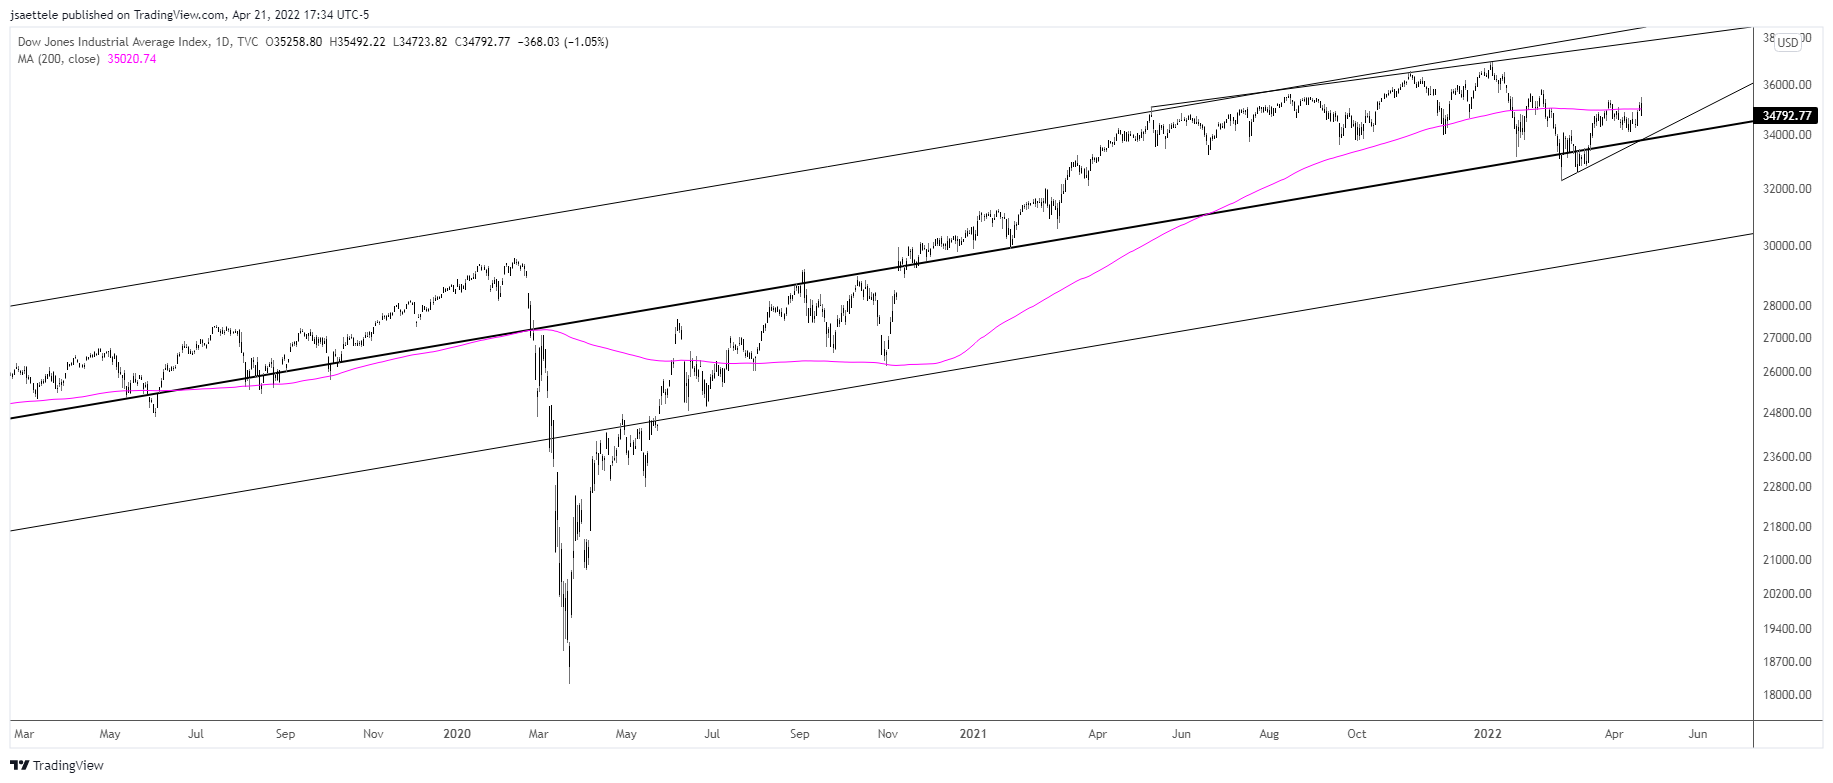
DOW JONES INDUSTRIAL AVERAGE (DJI) DAILY
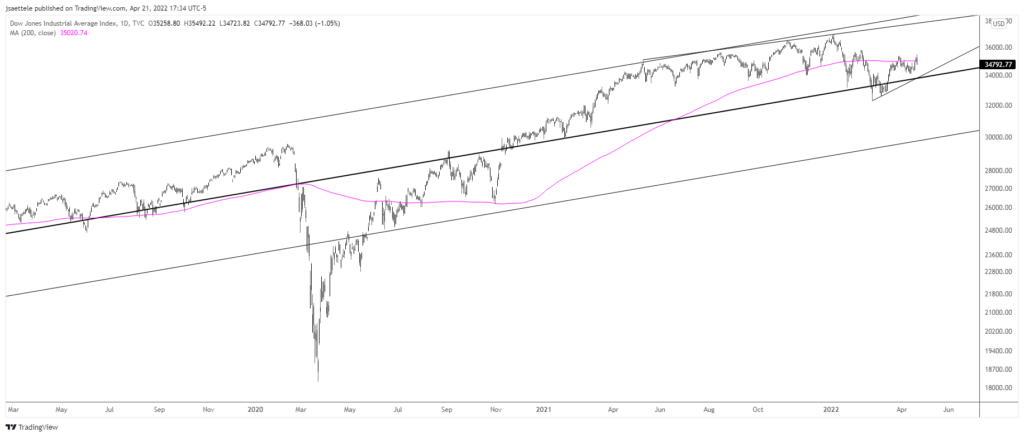
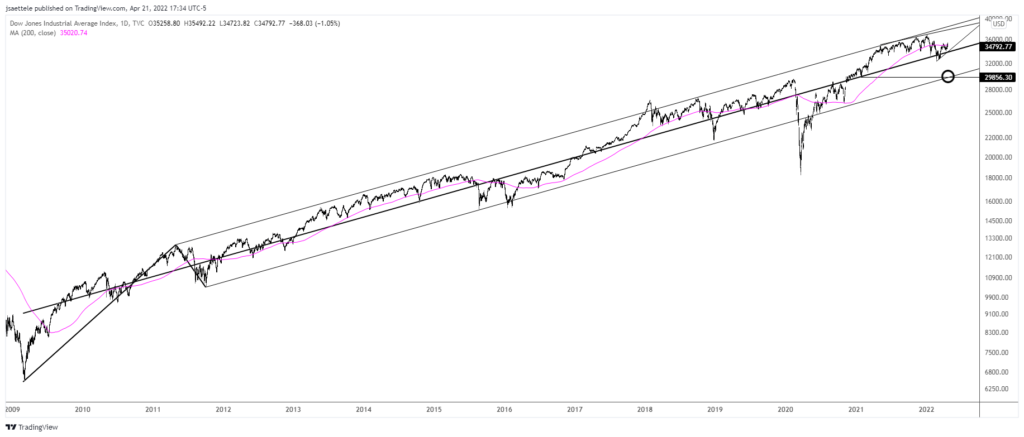
The Dow traded to its best level since 2/10 today before plummeting all day and forming a massive bearish outside day in the process. Scroll out and you’ll see that price has been pressing against a flat 200 day average as well. I’m wondering if this is a larger trend change. It’s safe to say that the broader trend has shifted from up to sideways. If price breaks the long term center line then the trend will be considered down with focus on 29800 or so. The full picture from the 2009 low is below.
DJI DAILY
SPOT GOLD DAILY
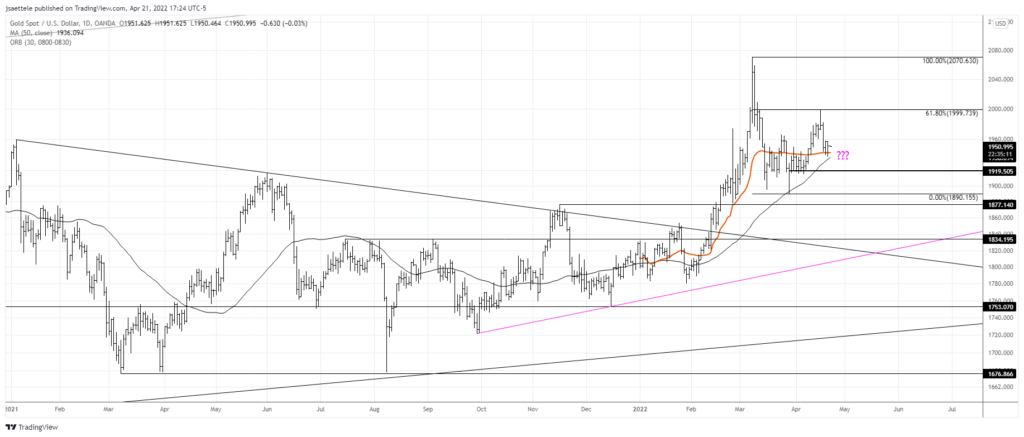
Gold has been ‘digesting’ the emotional blow-off that occurred in early March. I’m starting to get interested in the long side again with price testing 2022 VWAP and the 50 day average just under the current market. This average was support on 3/29 and tends to act as support during strong up-trends.
Do you make a profit trading Gold?
Try our funded trader program and get up to $1,000,000 in funding.
Learn more
EURUSD HOURLY
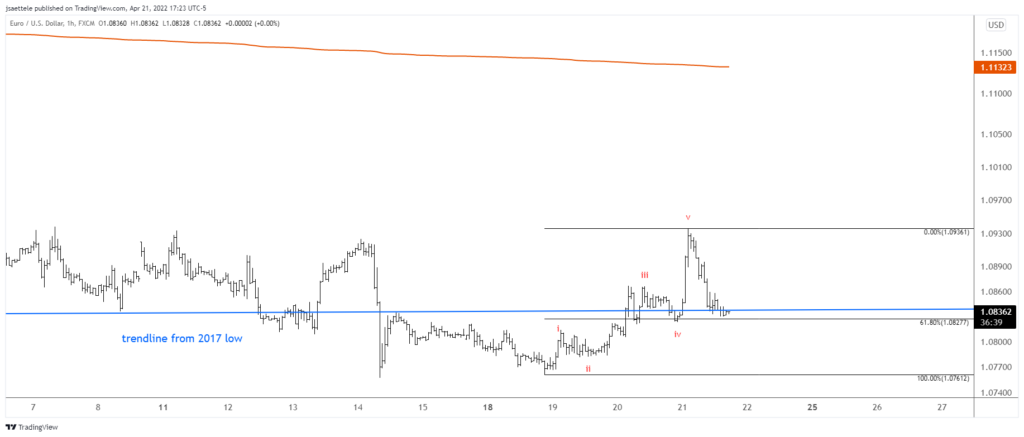
EURUSD took out last week’s high on Thursday before plummeting back towards unchanged on the day. If this is a bottoming process (since early March) then it’s one of the more frustrating bottoming processes that I can recall. Price continues to trade around the trendline from the 2017 low. With this in mind, I think that Friday’s close is important. Finally, 5 waves up from the low are evident so I’m looking for the low to hold and for EURUSD to resume higher.
4/14 – I was confident that yesterday marked ‘the low’ in EURUSD. In this business, be prepared to get egg on your face because Mr. Market will prove you wrong time and time again. There is nothing to do but move on! Fast forward one more day and I’m not ready to give up on the possibility of a low. In fact, price closed right at the trendline from 2017 (again) and left a long lower wick. There is also RSI divergence with the March and April lows. In summary, there is evidence to at least entertain the idea of a low. Tomorrow is Good Friday so we’ll probably have to wait until next week for resolution.
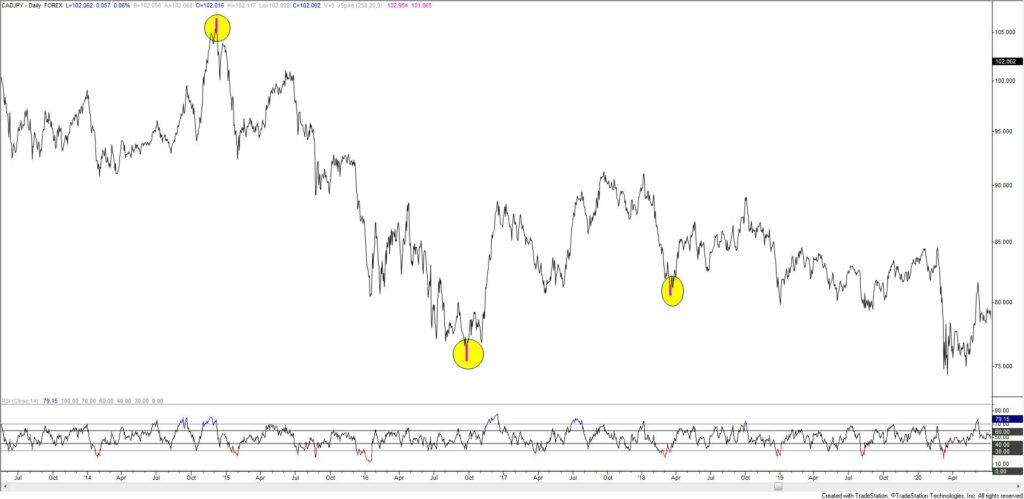
CADJPY DAILY
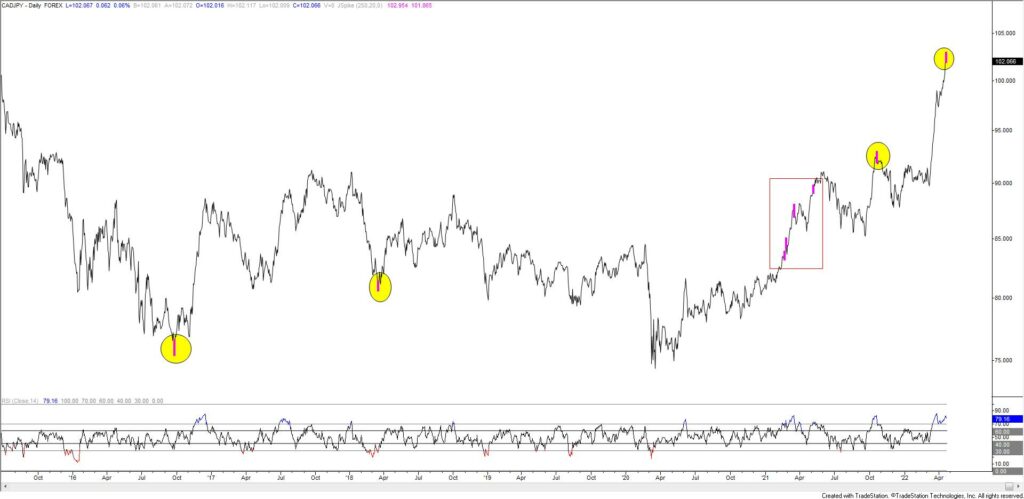
CADJPY made a J-Spike reversal (key reversal with a volatility filter) today. This chart and the next show signals over the last 7 years. Aside from signals in 2021, these signals have identified major turns. If we get downside follow through tomorrow then I’ll zoom in to view the near term pattern and possibly plot a short entry.
CADJPY DAILY