Market Update 4/20 – Bonds and USD Reverse
DXY DAILY
George Soros explained when it’s important to go against the trend and go contrarian…
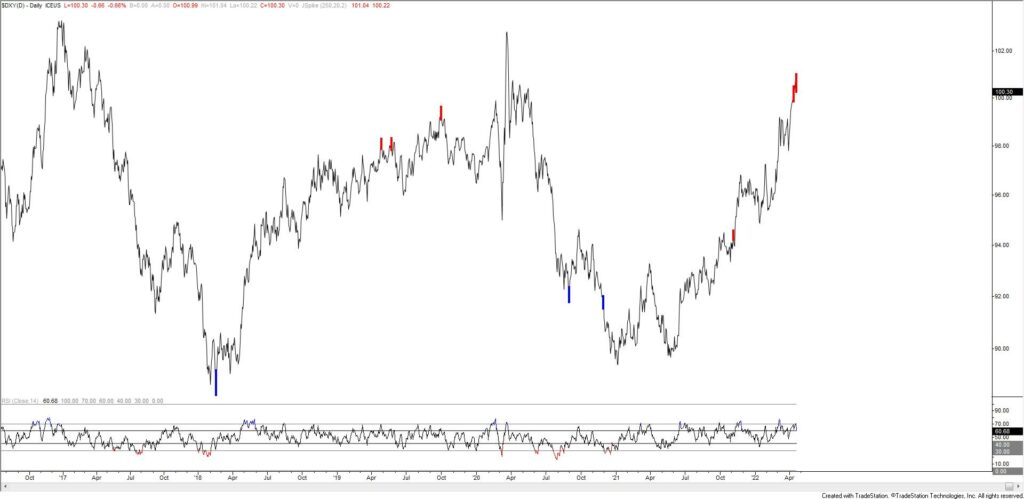
“You want to be a trend follower when there’s a lot of people saying ‘this move makes no sense’ and a contrarian when people are saying ‘this makes so much sense’. This is why a bull climbs a wall of worry and a bear falls down the stairs of hope.” The article below by Paul Krugman in the New York Times is the sign that ‘this move makes sense’ so maybe the USD can finally reverse! By the way, DXY made a key reversal today (the signals on this chart include a momentum and volatility filter).
Krugman – Why the Dollar Dominates
USDJPY DAILY
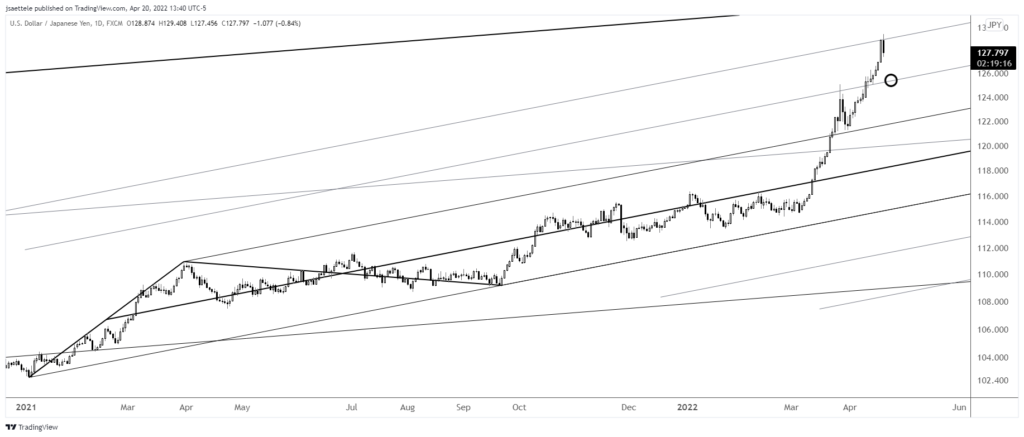
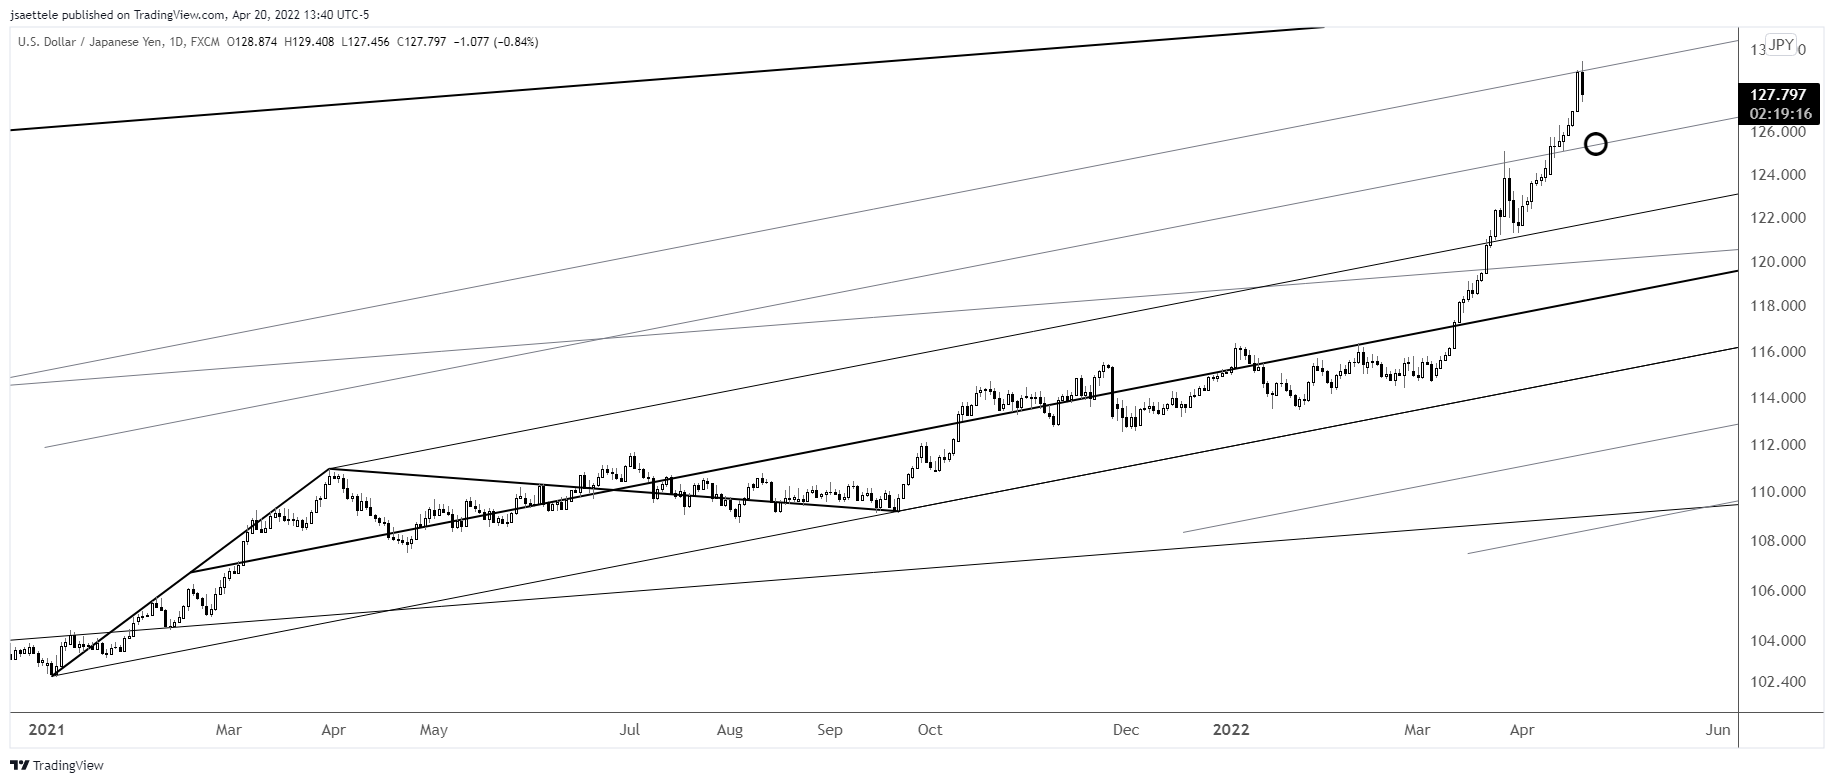
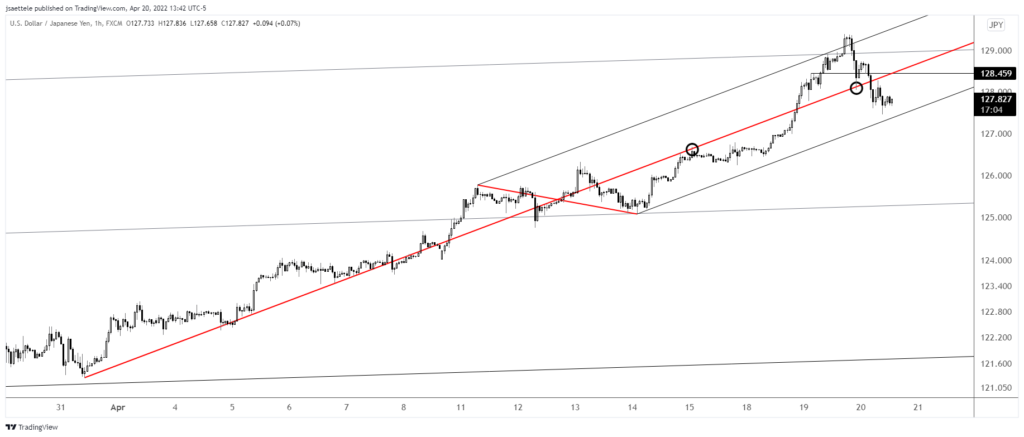
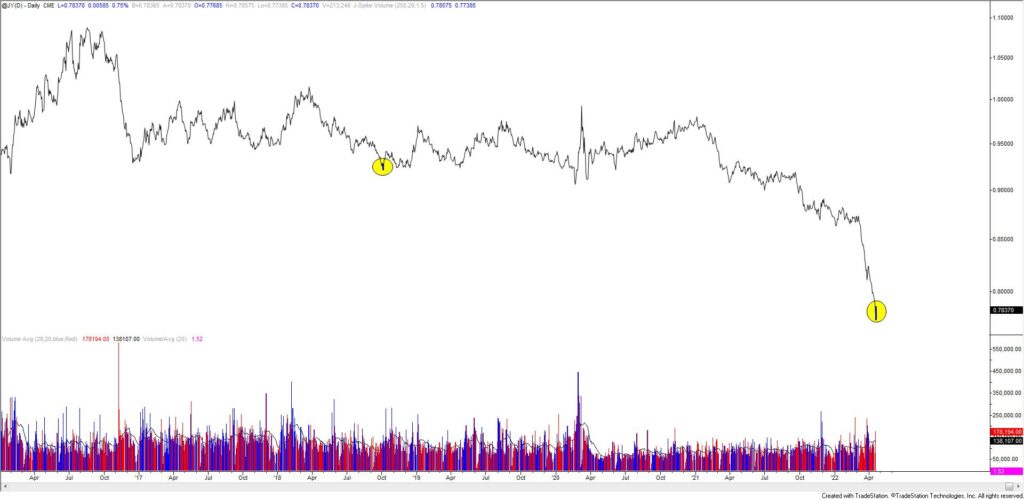
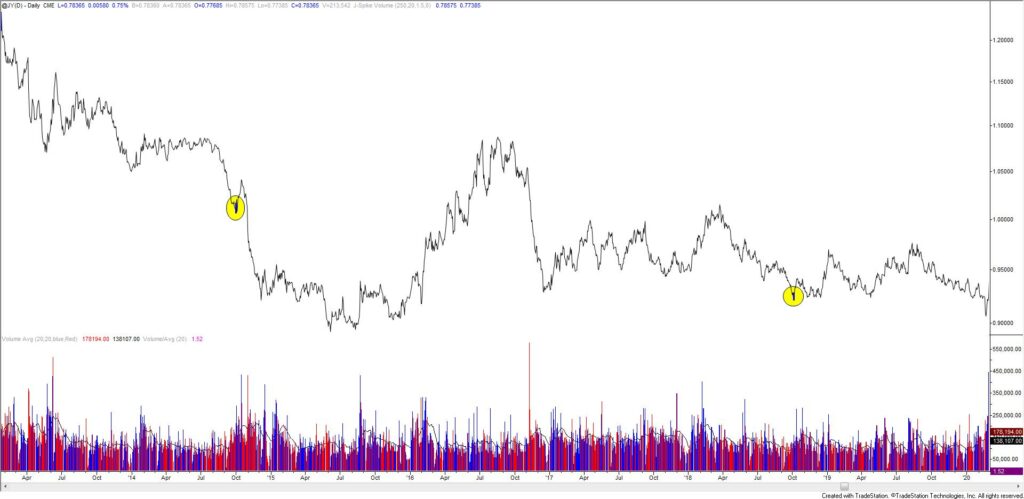
USDJPY didn’t quite make 130 but notice the channel from the 2021 low. 1/2 and full channel extensions are plotted with the channel. The March high was at the 1/2 channel extension. Today’s high was at the full channel extension. Near term focus is on the 1/2 channel extension near 125.30, which was formerly resistance. Near term, watch for resistance near 128.50 (see below). Finally, a volume reversal (on futures) triggered today. This is only the 3rd such reversal since 2014. Those charts are below.
4/19 – Yen headlines are getting extreme as strong language is being used to describe the recent USDJPY move. These headlines tend to occur near turning points. The center line from the channel that originates at the 2011 low is about 130. That’s the only spot that makes sense for resistance from my view.
Do you make a profit trading USD/JPY?
Try our funded trader program and get up to $1,000,000 in funding.
Learn more
USDJPY HOURLY
JAPANESE YEN FUTURES DAILY
JAPANESE YEN FUTURES DAILY (2014)
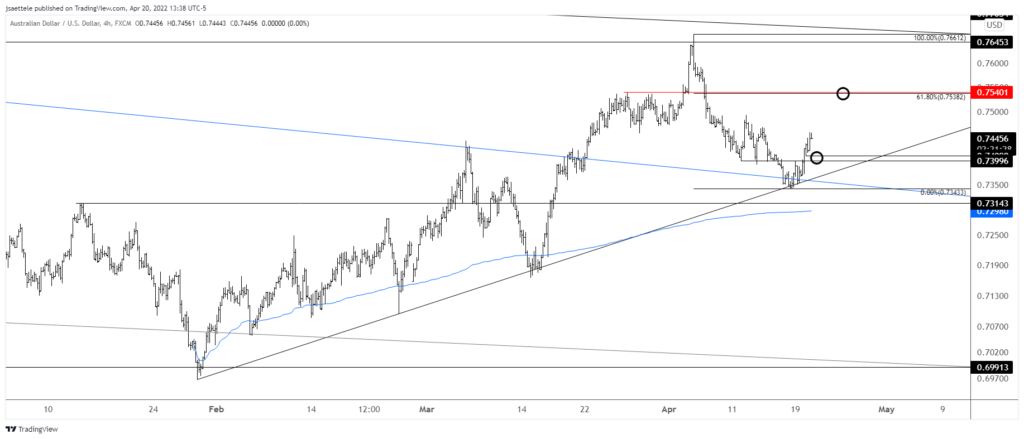
AUDUSD 4 HOUR
Kiwi has also turned up from proposed support (61.8% retrace). .6760s (2022 VWAP) is now proposed support and focus is on the well-defined .6890.
4/18 – NZDUSD has reached the 61.8% retrace of the rally from the January low. Price is also trading at the March low (3/15 low). This is a well-defined level and I’m looking for a turn higher. Proposed resistance is now the underside of former trendline support (red line) near .6850.
USDCAD DAILY
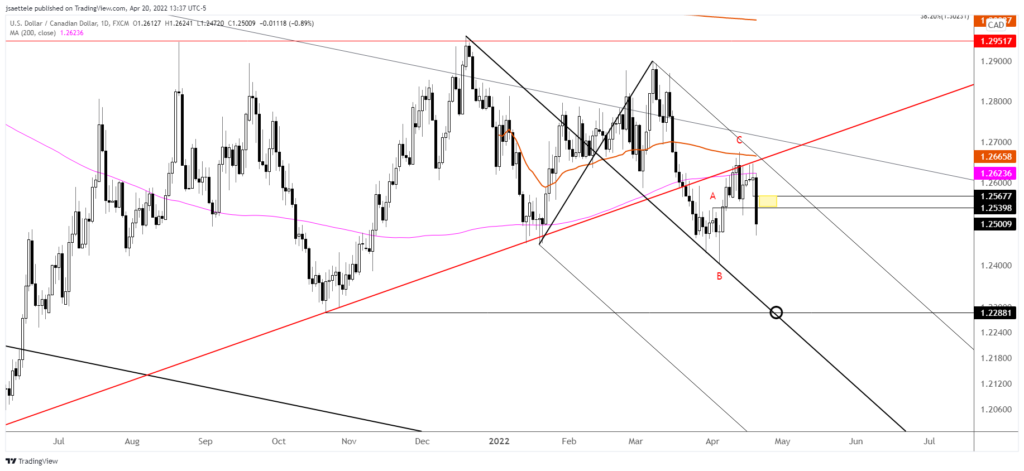
USDCAD has finally turned sharply lower from the underside of the trendline that originates at the 2021 low. The next downside level of interest is the October low at 1.2288. This is also the median line of the fork from the December high, which was support in March and April. 1.2540/70 is proposed resistance.
4/13 – USDCAD traded around the underside of the trendline from the 2021 low for 3 days before finally reversing lower today after BoC. The bearish outside day today strongly suggests that a tradeable high is in place. Proposed resistance is 1.2610/20 (see short term chart below). The next downside level of interest is the month open and 61.8% retrace at 1.2507. I remain of the mind that a flat completed from the 3/30 low which means that I’m looking for an eventual break below the April low.

