Market Update 4/19 – USDCNH Breakout
TLT DAILY
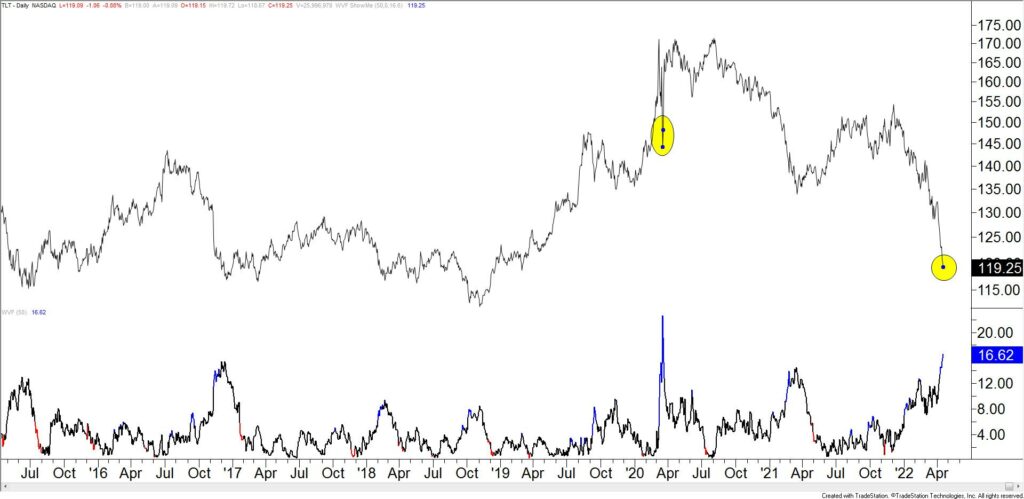
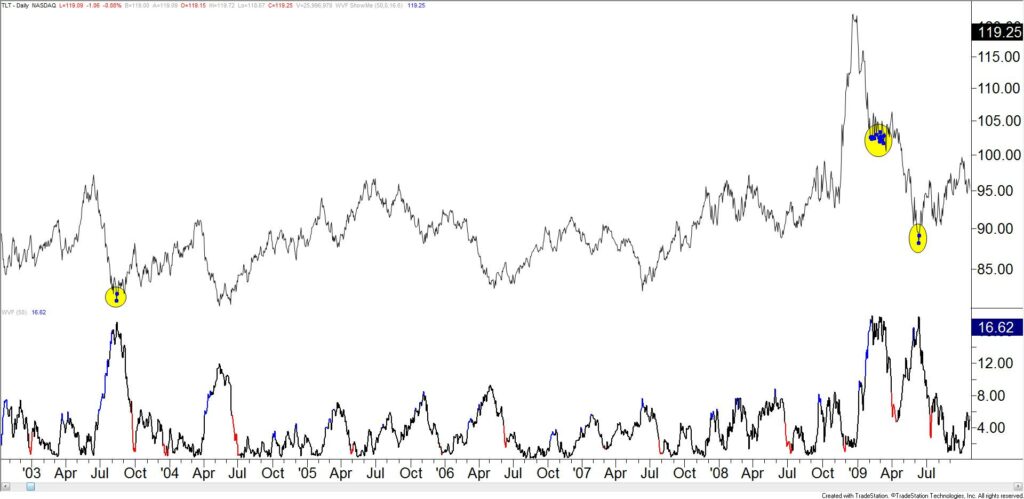
My gut is that we’re close to a turn higher in bonds and lower in USDJPY. The next few charts make that ‘argument’. This TLT chart shows TLT with a synthetic volatility indicator (the indicator attempts to produce a VIX). Extremely high readings occur at market lows. The current reading has only been seen 4 times in history; March 2020, twice in 2009, and in 2003 (see below). Don’t forget about the long term parallel on the price chart (2 charts down) as well.
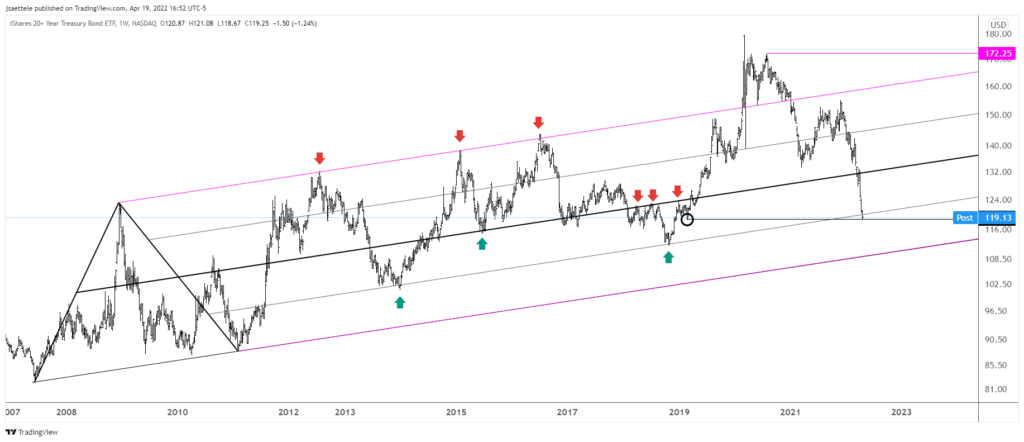
4/14 – It’s clear that the USD won’t roll over until/unless rates stop going up. TLT is the long bond ETF, which moves inversely to rates. So, a turn higher in TLT means a turn lower in rates. This could happen soon because TLT is closing in on a massive level defined by 2 legs down from the August 2020 high (using this high rather than the COVID spike high…the August high is the daily and weekly closing high) at 119.94. It’s also the 25 line within the channel from the 2007 low. This line nailed the 2013 and 2018 lows. Finally, the decline channels. If we do get a reversal then there should be a USDJPY play.
TLT DAILY (2003-2009)
TLT WEEKLY
USDOLLAR DAILY
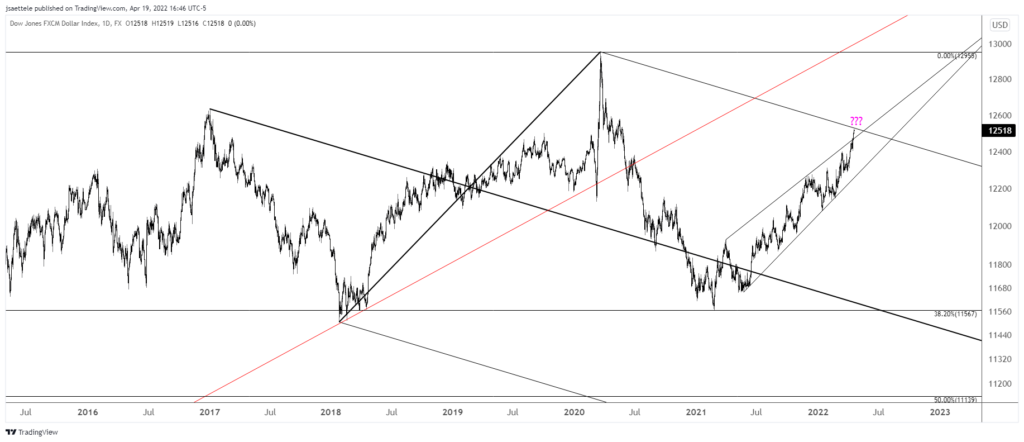
USDOLLAR has reached the upper parallel from the long term fork. Simply be aware that this is a level that could ‘produce’ a reversal.
4/12 – We haven’t looked at this one in a while but USDOLLAR is pressing against the year long upper wedge resistance. In fact, the upper wedge line originates at the April 2021 high. If there is an ’emotional’ blow-off move then price could test the upper parallel from the long term pitchfork near 12534. Like DXY, USDOLLAR is also up 9 days in a row.
Do you make a profit trading USDOLLAR?
Try our funded trader program and get up to $1,000,000 in funding.
Learn more
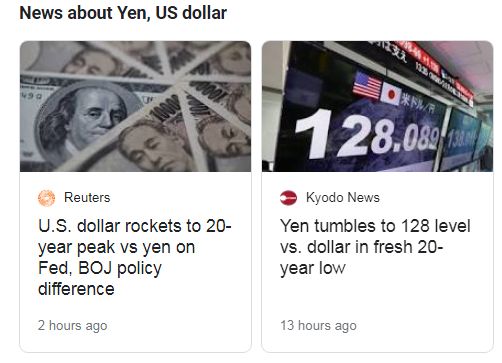
EXTREME YEN HEADLINES
USDJPY WEEKLY
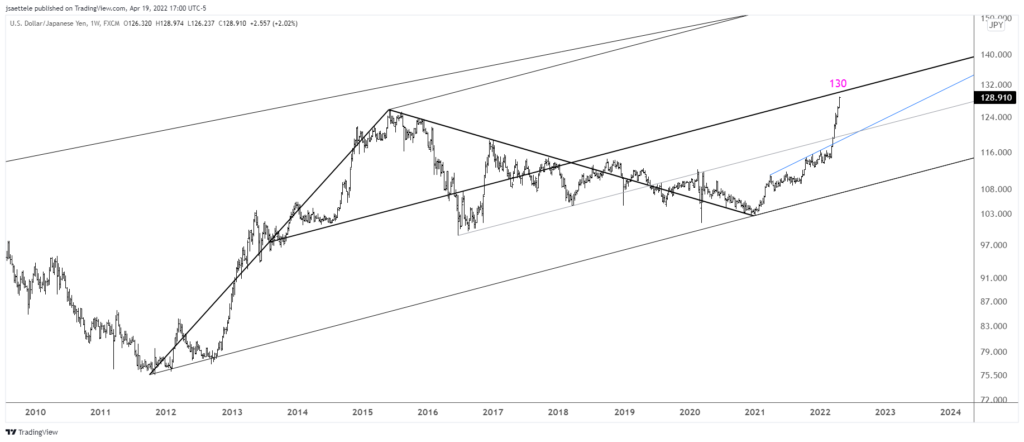
Yen headlines are getting extreme as strong language is being used to describe the recent USDJPY move. These headlines tend to occur near turning points. The center line from the channel that originates at the 2011 low is about 130. That’s the only spot that makes sense for resistance from my view.
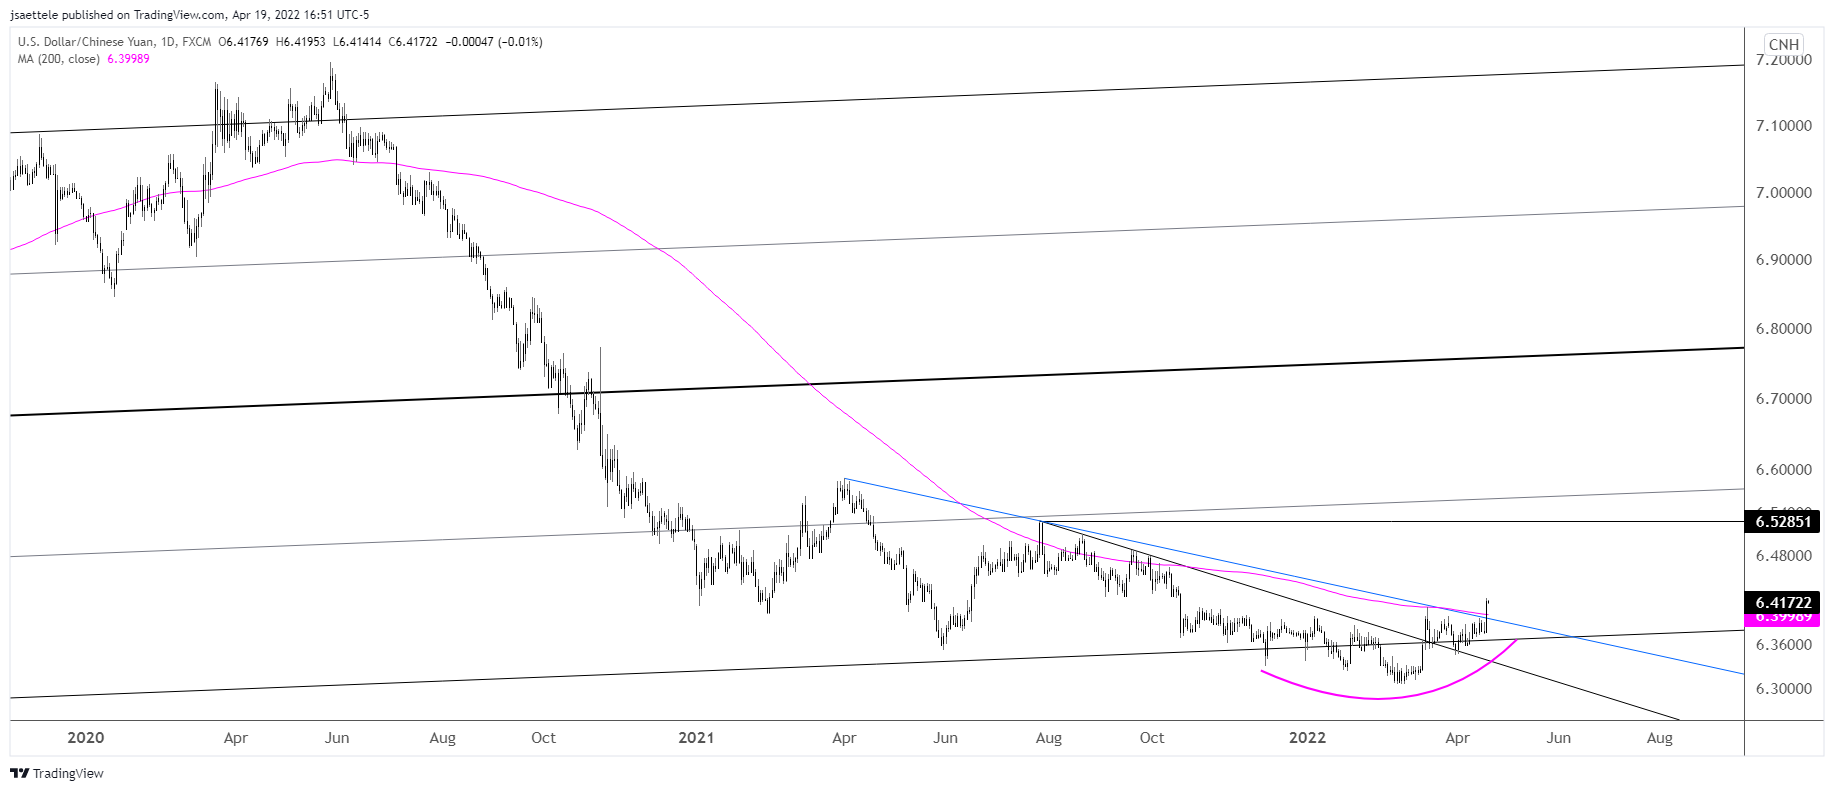
USDCNH DAILY
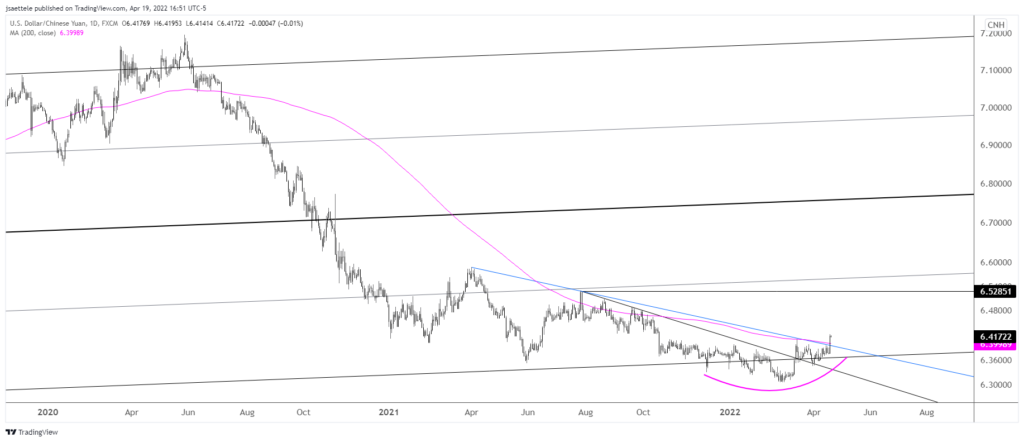
USDCNH broke above a year long trendline today and price also completed a 4 month head and shoulders pattern today. Watch the top side of the blue trendline for support near 6.3930. I realize that this goes against the idea of the USD topping. Maybe the USD has more to go that previously thought?


