Market Update – April 22
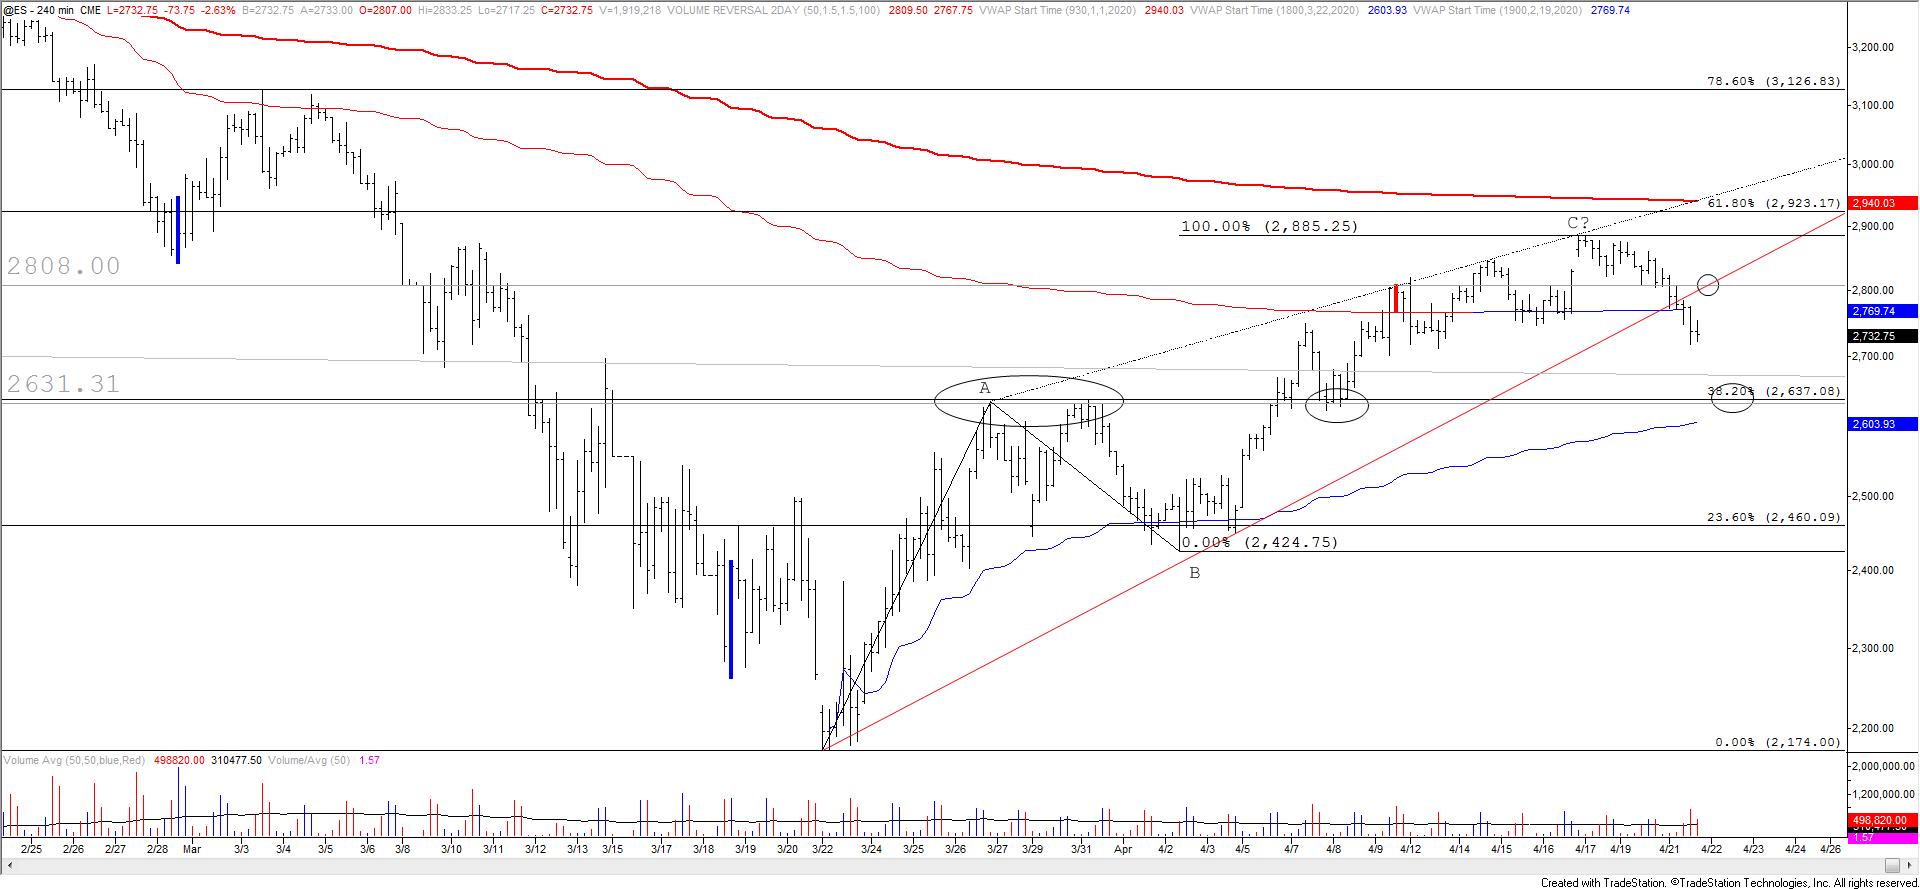
S&P 500 FUTURES (ES) 4 HOUR
Today’s ES break confirms the rally from the March low as a wedge. The implication is that the March low will eventually be re-tested. Near term, I’d still watch for a bounce from 2600/30. Proposed resistance is now the underside of the broken wedge line at 2808.
4/20 – Remember the 4 hour volume reversal on 4/9? ES failed to follow through on that reversal but price is back to that level. 2923/48 wasn’t reached but the rally from the March low consist of 2 equal waves…exactly. So, there is reason to ‘think’ that a countertrend rally is complete. Pay attention to 2770, which is the trendline from the low and VWAP from the February high. A break below there would also leave the rally from March as a bearish wedge, which would suggest an eventual re-test of the low. The next immediate spot to watch then would be 2600/30 (VWAP from the low and recent resistance and support).
NASDAQ FUTURES (NQ) 4 HOUR

NQ traded to the noted level and held…low today was 8342. Decision time! My ‘guess’ is that the level breaks since ES has completed a wedge. From a very short term pattern perspective, it appears that one more thrust lower could complete 5 waves down from the 4/16 high. Once/if the near term pattern does clear up, then I’ll share my views. All you need to know right now is that price held important support today.
4/20 – NQ traded into 8914 and has responded. The uptrend from the low is intact as long as price is within the channel. The lower channel line then is the key spot to know for a change in behavior in the 8320/67 zone (also VWAP from the February high, 3/10 high, and longer term parallels).
GOLD FUTURES 4 HOUR

Gold spiked under 1672.50 and reversed higher. The drop is in 5 waves which supports the idea that a more important high is in place. Ideal resistance is 1742.60, which is the 61.8% retrace and 4/7 high. I know that a lot of you (most?) trade spot rather than futures so I’ve included a spot chart below. The equivalent level for resistance on spot is 1709/15.
4/19 – Gold reversed from massive resistance last week (long term parallel is shown on the weekly chart below). I am bearish…at least near term. If the decline from last week’s high unfolds in 5 waves, then I’d be confidently bearish against the high and look to short a rally. For now, just know that levels to watch are 1672.50 for support (keep in mind that this is futures and not spot) and 1724.20 for resistance.
GOLD SPOT 4 HOUR

USDOLLAR 4 HOUR

There is no change to USDOLLAR comments. Focus remains higher towards 12692. That’s the ideal level for price to attempt to carve a lower high. Another level that I’d consider as potential resistance is where the rally would consist of 2 equal legs at 12630.
4/15 – USDOLLAR dropped to 12445 (exactly) and the drop is in 5 waves so immediate focus is higher towards 12692. This is the former 4th wave high and long term parallel (red line) that crosses highs and lows since September 20187.
GBPUSD 4 HOUR

GBPUSD broke down so focus is on the mentioned 1.2164. The bearish setup is to short a rally into the underside of the parallel that was previously support. That line is about 1.2410 now.
4/20 – GBPUSD is testing the parallel that extends off of the wave 1 high. This line was precise support for the wave 4 low. A break below here would present a bearish opportunity for a run at 1.2164 (wave 4 low and 38.2% retrace of the 5 wave advance).
NZDUSD HOURLY

The NZDUSD drop stalled at the median line from a short term bearish fork today. This is a short term decision point. Either price consolidates/bounces before resuming lower or price breaks the median line and the decline accelerates. Eventually, the lower parallel may be where we look to exit shorts and flip to bullish. The situation is fluid but I’d expect .6030s resistance if price does bounce.
4/16 – NZDUSD, which has lagged AUDUSD, is probably a better near term short. The decline from this week’s high is impulsive and probably wave A of an A-B-C corrective decline because the rally from the March low is in 5 waves (impulsive…view an hourly line chart to see that waves 1 and 4 do not overlap). The implication is that price bounces in wave B before turning lower in wave C. Focus for resistance is .6030. Initial downside focus is the 4th wave of one less degree at .5843.
AUDUSD HOURLY

I’m honing in on very short term levels in AUDUSD. .6214 is still proposed support but resistance is slightly lower near .6338. This was support on Friday and Monday and is also near the 200 hour average, which was precise support last week.
4/20 – AUDUSD traded into .6398 and reversed. My near term view is that a lower high is in place. Proposed resistance for short entry is the week open at .6364. The first level to pay attention to on the downside is the 3/31 high at .6214, which is also near the 20 day average. I’m not willing to look much further out than that right now but the next level to be aware of on the downside is .6100ish (VWAP off of the low and 38.2% retrace…see futures chart below). Also, seasonal tendencies are bearish through May.


