Market Update 2/1 – Bullish USD Head and Shoulders Patterns
DXY DAILY

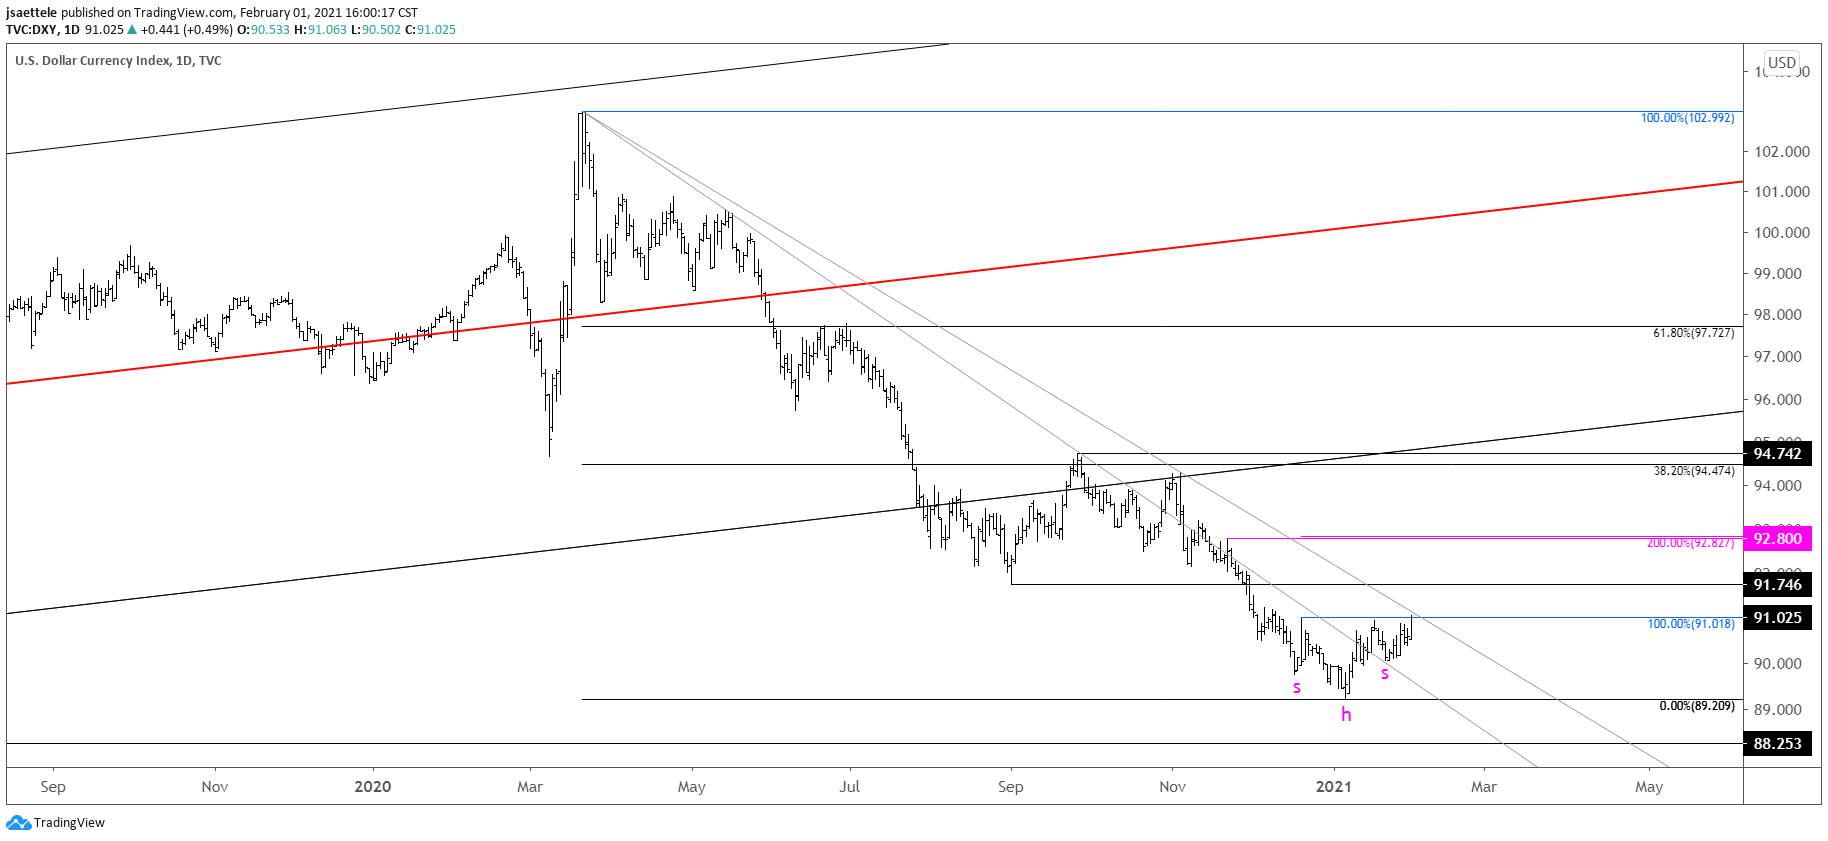
DXY is trading right at the neckline from a head and shoulders bottom pattern. The objective from the pattern is 92.80 (magenta line) but the former low at 91.75 is a possible pausing level. Ultimately, I’m looking towards the underside of former channel support. This is near 95 and in line with the March low, former 4th wave high, and 38.2% retrace of the decline from the March high (see weekly chart below).
1/26 – The line in the sand for DXY is clearly the upper parallel of the Schiff fork from the March high (along with the 50 day average…not shown). Price ideally holds 90 in order to maintain the short term bullish fork.
DXY WEEKLY

EURUSD 4 HOUR

EURUSD finally appears ready to accelerate lower. 1.1960s or so is well-defined as possible support however. The level includes the top side of the line of of the 2008 and 2014 highs, center line of the channel from the March high, and resistance from August (weekly chart is below). On a shorter term basis, there is also the lower parallel of a Schiff fork.
1/28 – The EURUSD bounce has encountered resistance from the underside of a former short term support line. Focus remains lower towards the center line of the channel from the March low, which is reinforced by the line off of the 2008 and 2014 highs (blue line…see weekly chart below for full view) near 1.1950.
EURUSD WEEKLY

USDSEK 4 HOUR

USDSEK is testing (and trying) to break above important resistance defined by the January high and channel resistance from the March high. Like DXY, an inverse head and shoulders pattern is present. The objective is 8.7365.
1/26 – Maybe the Scandis are offering clues regarding the bigger picture for the USD? USDSEK remains within a bearish channel from the March high but is nearing possible support from both the 61.8% retrace of the rally and a parallel that was resistance for several months (highlighted). Like DXY and EURUSD, there isn’t much room for error…either the USD turns up here or ‘who knows’.
USDCHF 4 HOUR

Not surprisingly, USDCHF also sports the inverse head and shoulders pattern since mid-December. Price could pull back from near .8980 but the objective from the pattern is .9080. January’s low could be significant however given the 2 month volume reversal in FXF (Swiss Franc ETF…see below).
FXF MONTHLY

BRITISH POUND FUTURES DAILY

GBPUSD continues to churn at its best levels since April 2018. Interestingly, a 2 day volume reversal triggered on Friday. Notice that bullish reversals have ‘worked’ well over the last 6 years. Near term, price action in recent weeks resembles a wedge and price is testing the wedge barrier now. Also, a bit more weakness would break 2021 VWAP…which I view as an objective bull/bear dividing line.
BRITISH POUND FUTURES HOURLY

USDCAD 4 HOUR

Watch for support now near 1.2800 (former resistance in USDCAD). Short term upside focus remains 1.2950. Bottom line…still bullish in the near term (at least).
1/31 – There is no change to the near term USDCAD outlook. Focus remains on 1.2950 and the top side of former trendline resistance (blue line) remains proposed support. That line is near the 61.8% retrace of the rally from the low at 1.2700.


