Market Update – July 31
USDOLLAR DAILY
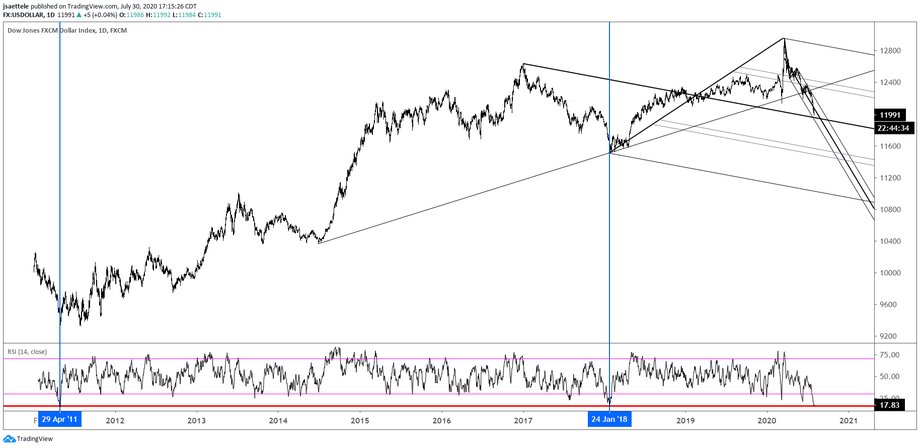
USDOLLAR daily RSI is 16.53. It’s only been that low twice (date since 2011); at the April 2011 low and the January 2018 low. Levels wise, the median line of the fork from the 2017 high is about 11950 (see close up below), which is in line with the lower parallel of the Schiff fork from the March high. It’s a logical place for a reversal.
7/29 – USDOLLAR (EUR, GBP, AUD, and JPY) is testing a major level (daily chart is below). Price reacted today at the top side of the center line of the Schiff fork from the March high and the top side of the line off of the March and May highs. This is a great spot for a bounce. Pay attention to the upper parallel and former support at 12253. A break above there would indicate an important behavior change.
USDOLLAR 4 HOUR

USDSEK DAILY

USDSEK is nearing the full extension of the channel from the 2018 low. Within the decline from the March high, wave 5 equals 61.8% of waves 1 through 3 at 8.6522. Price is also at the lower parallel of the channel from the March high. I sound like a broken record but this is a logical spot for a reversal attempt.
USDCAD DAILY

It wasn’t all USD weakness today. USDCAD actually traded to a 6 day high. Price is testing channel resistance from the March high. In the event of a break above the line, the target would be the full extension which is currently about 1.4000 (decreases about 18 pips per day). Watch or 1.3380 support.
GBPAUD 4 HOUR

GBPAUD support should be the top side of the center line within the channel from the March high now. That’s about 1.8050s (early June support). Near term upside focus is the top of the channel just above 1.8600.
5/30 – Long Cable and short Aussie? It would make sense from the current level. GBPAUD reached the 61.8% retrace of the rally from October 2016 and the 200 week average today. Big level. The daily candle sports a long lower wick as well. Based on these observations, this is a good spot to take a bullish view on GBPAUD (long GBP, short AUD).


