
Market Update 4/7 – Know this Key DXY Level
CRUDE OIL DAILY
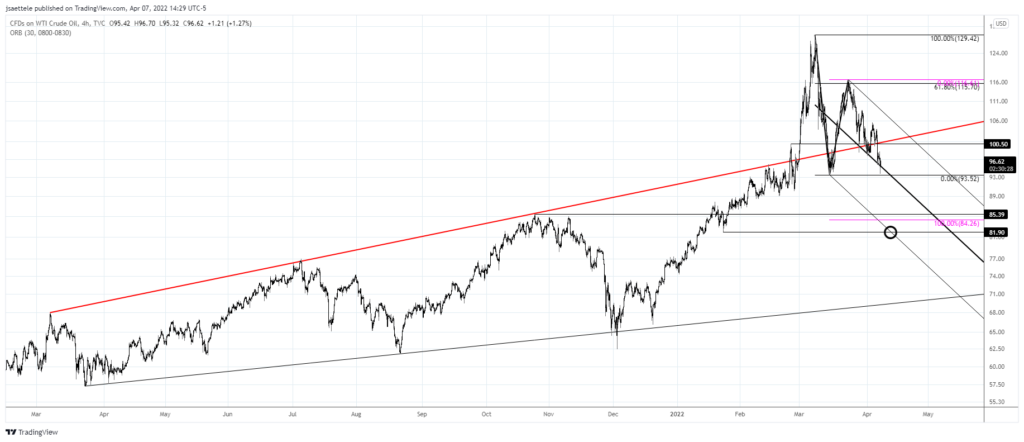
The 61.8% retrace nailed the lower high and crude is closing in on the 3/15 low. Be aware of the line that crosses the 2021 highs (red line). This is proposed resistance near 100.50-101.00. Notice that price has been riding the median line of a Schiff fork. This is important because a break below the median line would indicate a likely acceleration lower towards the lower parallel…currently in the low 80s.
3/21 – After plummeting under $100, crude is nearing the 61.8% retrace of the decline at 115.70. There are also several highs/lows near this price from early in the month. My view remains that we saw a massive blow-off top so watch for resistance and a lower high.
DXY DAILY
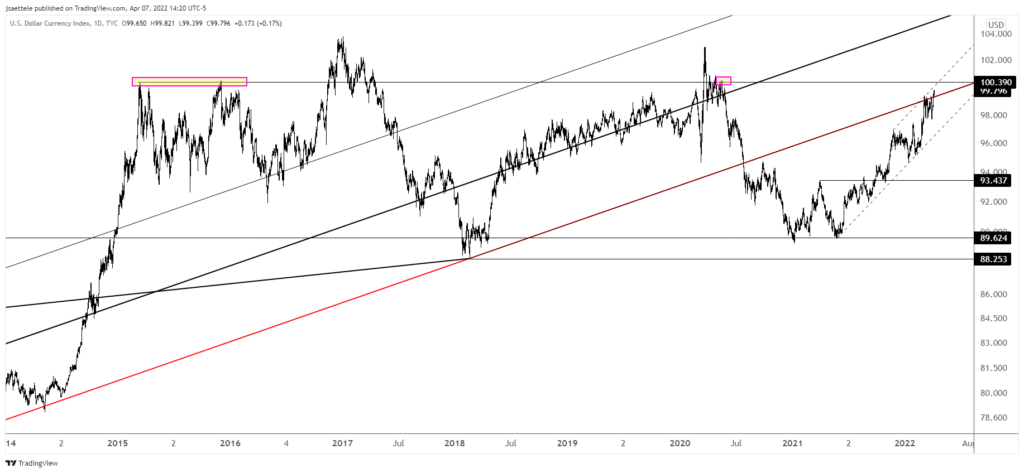
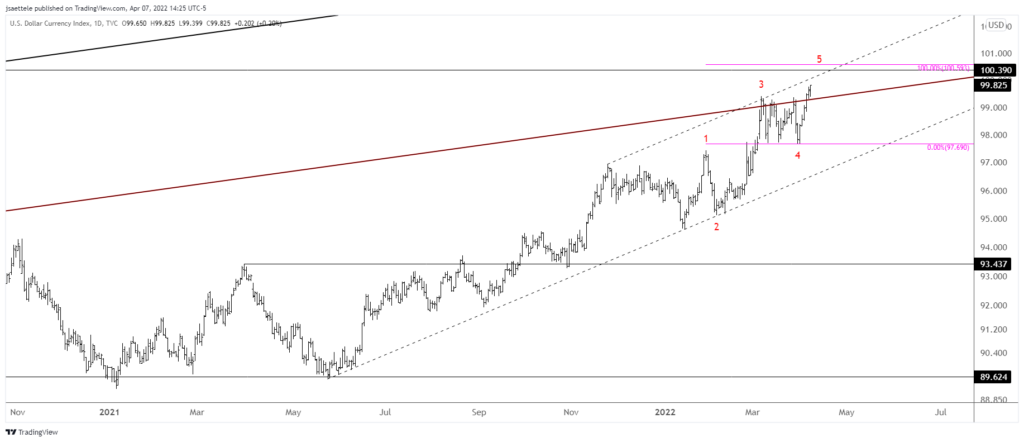
The ‘final leg higher’ option is unfolding in DXY. A key zone to pay attention to is 100.39/59. This is a well-defined horiztonal and where wave 5 would equal wave 1 within the sequence from the January low. Also, note that EURUSD has yet to trade beneath its March low. It may very well do so but a non-confirmation is in place until that happens.
4/4 – It’s possible of course that the DXY rally ended on 3/28 with a truncated 5th wave but it’s also possible that a final leg higher is in the works. I have to respect this latter potential because price didn’t hold below 98.70. EURUSD looks quite different and I don’t have an opinion there at the moment. Continue to focus on USDSEK though and specifically the median line for resistance (see below). In fact, I can envision a scenario where the final DXY high is put in with USDSEK at the median line. If this happens, then we’d have a drastic non-confirmation (divergence).
Do you make a profit trading DXY?
Try our funded trader program and get up to $1,000,000 in funding.
Learn more
DXY DAILY
EURUSD WEEKLY
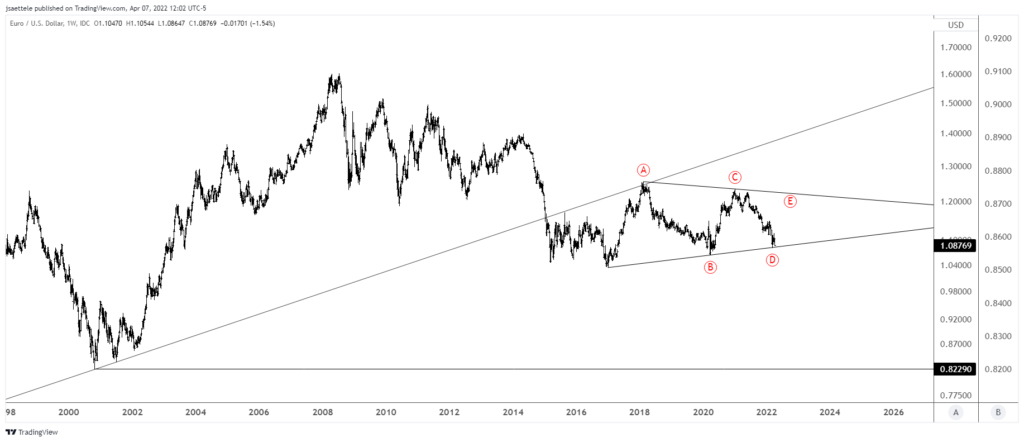
This is from the Long Term update earlier today. “Everything since the 2017 low may be a triangle in which case EURUSD is probably completing wave D now. The implication is that price turns up in an E wave and rallies back to 1.1850 or so.” The lower trendline is about 1.0835.
USDSEK 4 HOUR
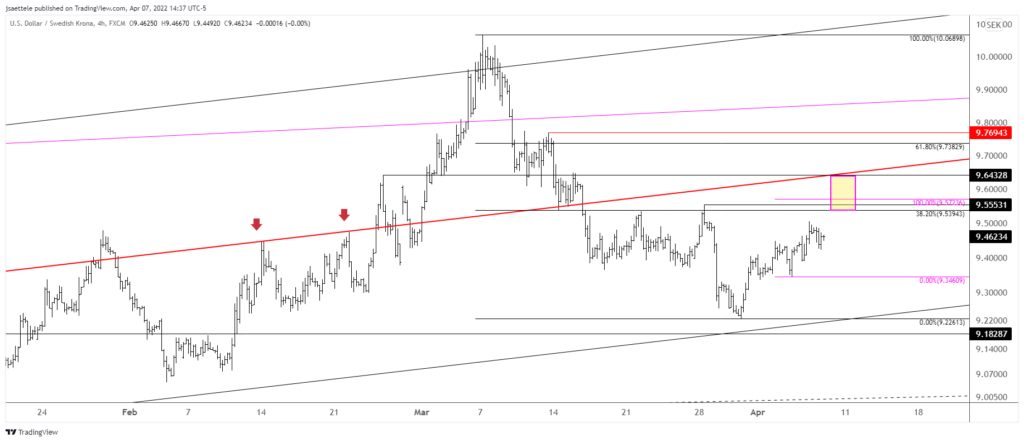
The median line (red line) remains key for resistance. That line is about 9.64 now. However, also pay attention to 9.54/57. This zone is defined by the 38.2% retrace of the decline from the March high, 3/28 high, and 2 equal legs up from the March low. Again, I think that USDSEK holds the key to when the USD starts to broadly decline (notably EURUSD advance).
3/21 – Pay attention to USDSEK, notably the underside of the median line, which has been precise resistance for nearly a year. The median line is now about 9.5650.
USDCAD 4 HOUR
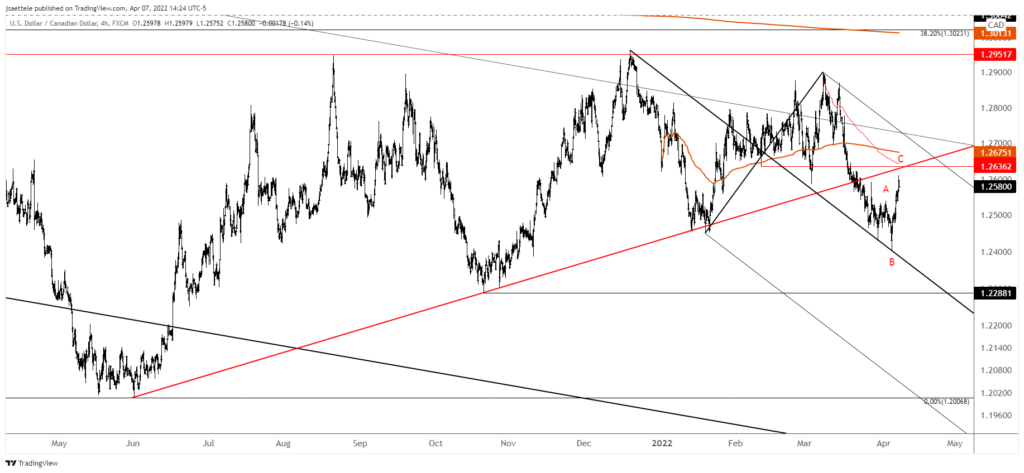
All eyes on 1.2635 or so for USDCAD resistance! The rally from the 4/5 low is clearly impulsive but the rally could complete a flat correction from the 3/30 low. Canadian jobs data is out tomorrow so we could get a spike into resistance before lower. I love ‘news fade’ setups…Aussie on RBA earlier this week is a great example.
4/6 – USDCAD appears well on its way to test the noted and well-defined 1.2620s resistance. In fact, VWAP from the March high is closing in on that level as well. Watch for support near 1.2510 now.


