Market Update 4/6 – Commodity FX Corrections Unfolding
BTCUSD DAILY
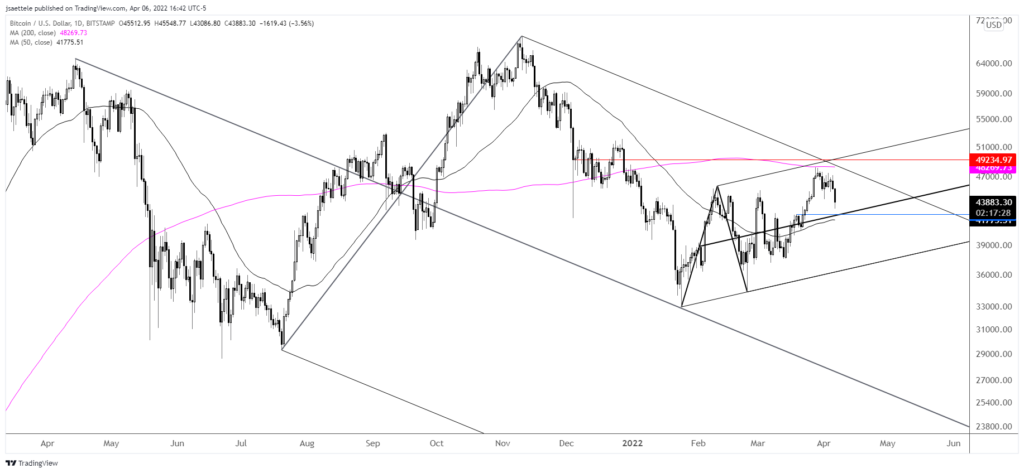
BTCUSD never quite made it to 49500 as the 200 day average held firm as resistance. I am broadly bearish at the moment but will note the 50 day average and center line of the channel from the low as possible support at 42400. Again, I’m thinking nothing but a bounce here before additional weakness.
3/28 – The triangle scenario described last week is no longer valid in BTCUSD. However, note that price has reached the 200 day average and the upper parallel from the median line of the fork that originates at the April 2021 high is slightly higher…near 49500. Pay close attention to that level for resistance if reached because since the January low registered right at the median line.
Do you make a profit trading BTC/USD?
Try our funded trader program and get up to $1,000,000 in funding.
Learn more
AUDUSD 4 HOUR
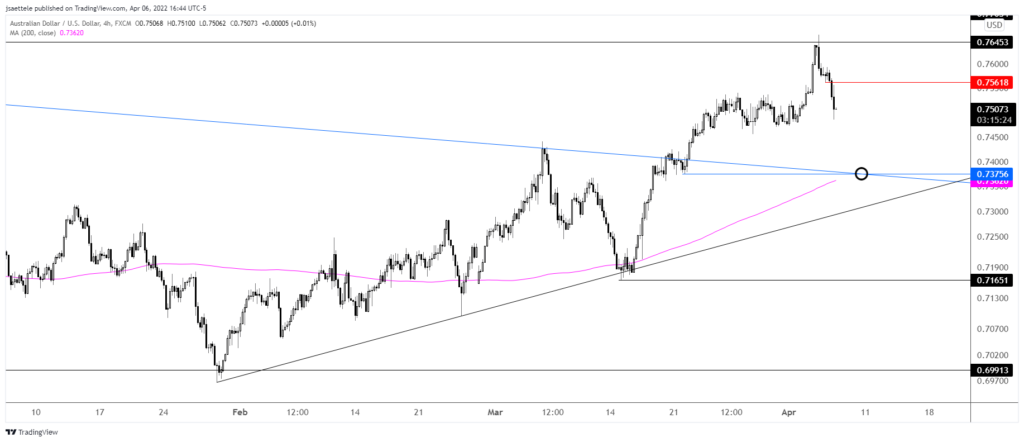
Aussie followed through on post-RBA action and the proposed corrective decline into .7375 or so is well underway. We might not get a bounce until .7455/70. I’d love to see the drop from the high in 5 waves before plotting a short entry but watch for resistance now near .7560.
4/5 – Tuesday’s Aussie spike on ‘news’ (RBA) has top written all over it. Price spiked into and reversed from a well-defined level (61.8% retrace of the decline from the 2021 high and former support) following RBA. Perhaps we’ll finally get the pullback into the top side of former trendline resistance (blue line), which is near .7375 now.
NZDUSD DAILY
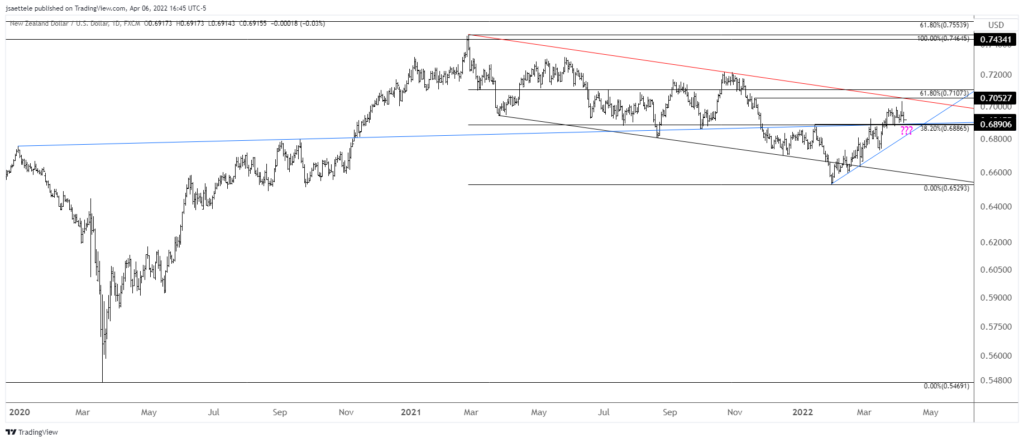
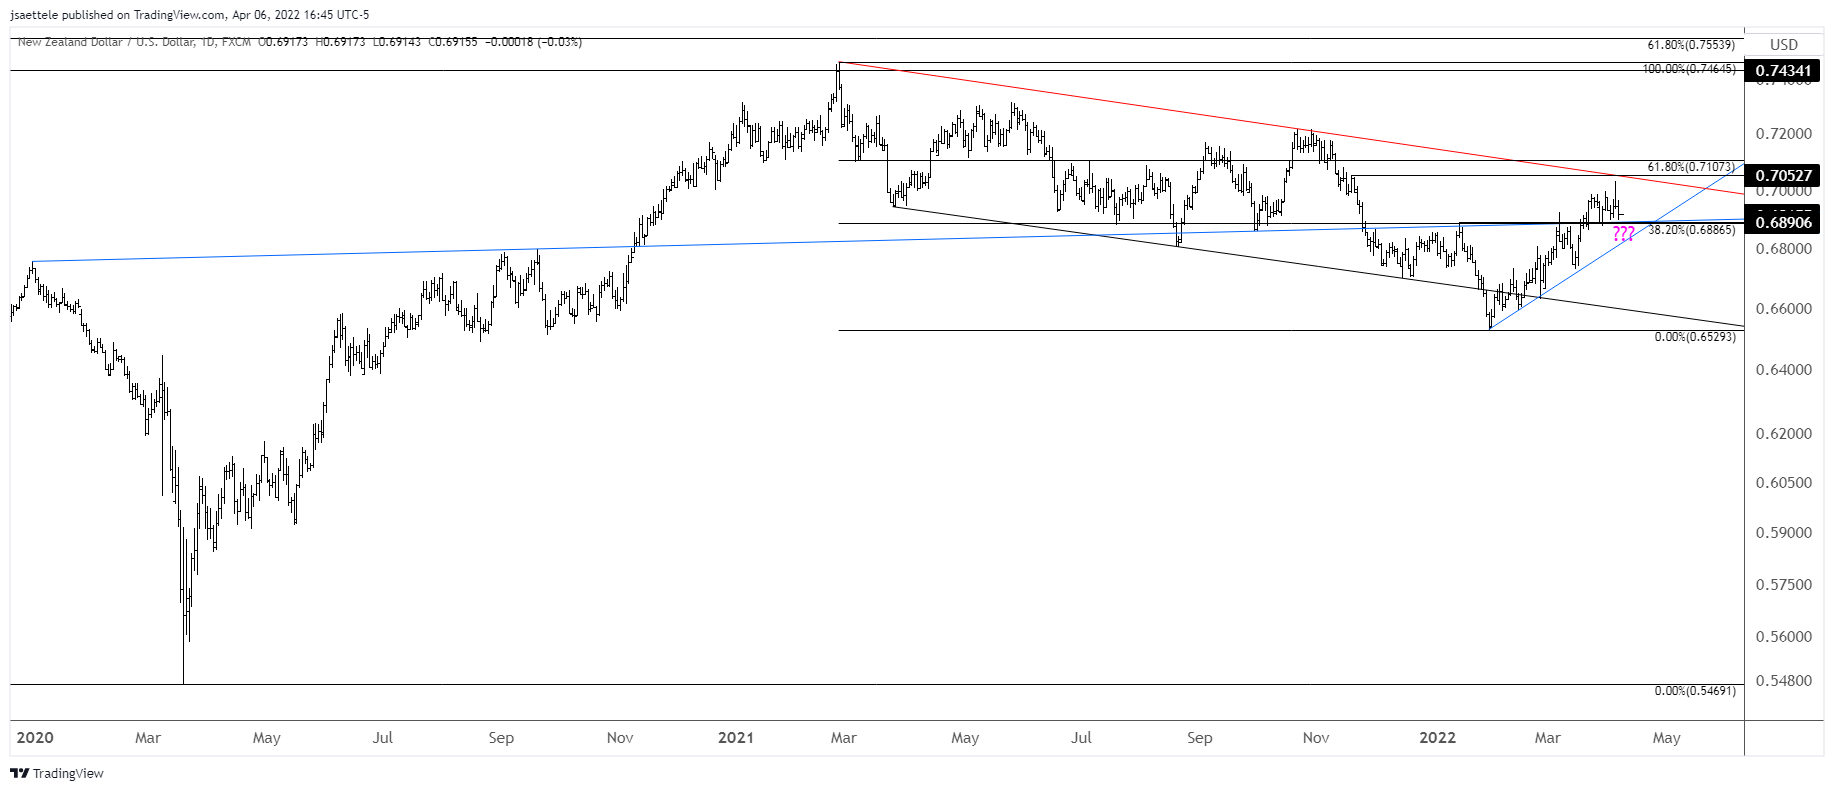
I’m torn on Kiwi given the prospect for a deeper AUDUSD pullback. In any case, continue to be aware of the long term neckline (blue line), which has been resistance and support so far in 2022. The line is about .6890. If we get a decent reaction at that level, then it will be worth taking a shot on the long side with a tight stop.
4/4 – There is no change to Kiwi as it continues to churn above well-defined support. Daily reversal support is an ideal spot for long entry at .6935. Near term upside focus remains .7050 although NZDUSD has a bullish longer term ‘look’ with 2 legs down from the 2021 high and the hold at the top side of a longer term trendline (see below).
USDCAD 4 HOUR
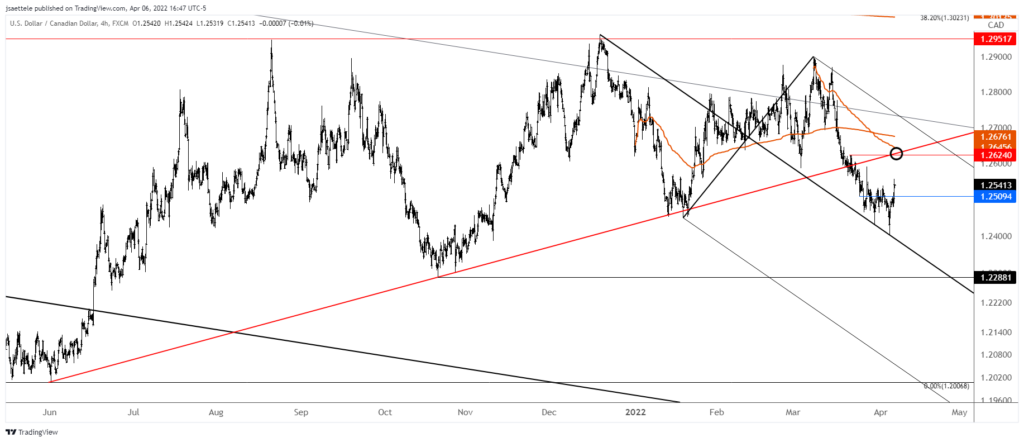
USDCAD appears well on its way to test the noted and well-defined 1.2620s resistance. In fact, VWAP from the March high is closing in on that level as well. Watch for support near 1.2510 now.
4/5 – USDCAD nailed the median line (described last week) again today and price formed a daily doji. The combination of the doji and level (median line) is perfect for at least an interim low. I’m looking towards 1.2620s resistance. The intraday chart below shows an impulsive advance so trading focus is on buying a pullback.

