Market Update – June 17
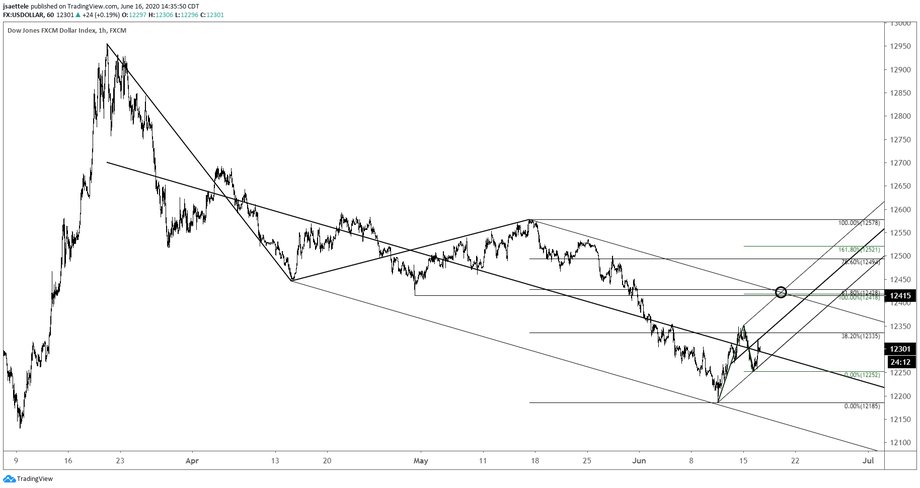
USDOLLAR focus remains towards 12428. In fact, 2 equal legs up from the low would be 12418. The upper parallel of the Schiff fork and short term bullish channel intersect 12418/28 on Thursday/Friday. The level is also marked by the 4/30 low.
6/14 – My view is that the USDOLLAR bounce is counter trend but it should carry higher before rolling over. The upper parallel of the Schiff fork is a candidate for resistance along with the 61.8% retrace of the decline from 5/18 at 12428. Watch for support from 12304 (more or less now).
COPPER WEEKLY

Copper broke below the 2008-2016 line in mid-March and made a ‘crash low’ on the 19th (AUDUSD low was on the 19th and U.S. equities bottomed on the 23rd). The recovery has tested the underside of the 2008-2016 line as well as closed the gap from 1/24. Pay attention to the short term rising support line near 2.5050. A break below would indicate a behavior change in copper and shift focus to 2.3950 (see below).
COPPER 4 HOUR

COPPER AND AUDUSD 4 HOUR

AUDUSD HOURLY

AUDUSD completed its flat pattern described yesterday. .6900 was midday resistance and I’m looking for that level to hold because it’s defined by the center line of the channel from the April low, which was resistance multiple times in May. Focus is on .6715 (2 equal legs down and the bottom of the short term bearish channel).
6/15 – Commodity currencies are forming flat patterns from Friday’s Asian session. AUDUSD has already exceeded the end of wave A so I’m on the lookout for a turn lower. I’m thinking that this happens from either the 200 hour average at .6930, the 61.8% retrace at .6961, or the 75 line within the channel from the 4/3 low at .6988.
EURUSD HOURLY

EURUSD failed in the cited zone (high was 1.1353) and focus is lower as long as price is below today’s high. 1.1120 is extremely well-defined from a slope perspective. It’s also the month open! That’s the short term bearish target and may be where we end up flipping long. Watch for resistance now at 1.1280/90.
6/15 – EURUSD is nearly back to the noted 1.1340. I’m on alert for a turn lower between 1.1340/72. The top of the zone is daily reversal resistance.
USDJPY DAILY

USDJPY has gone quiet again. High today was a few ticks under the month open of 107.70 and futures held both VWAP from the May high and VWAP from the June low (see below and remember that Yen support is the same thing as USDJPY resistance). In other words, perhaps we’ve seen a lower high in USDJPY. Near term action doesn’t do anything for me though as it pertains to entry so I sit. If anything, the described VWAP action suggests that Yen crosses are bearish.
6/14 – 107.77-108.08 is possible USDJPY resistance. The bottom of the zone is the underside of the line off of May lows and the 38.2% retrace of the decline from 6/5. The top of the zone is defined by highs in April and May.
JAPANESE YEN FUTURES 4 HOUR

AUDJPY 4 HOUR

AUDJPY rolled over where it should have today. I favor the short side against today’s high, notably because price is below 74.50 (February high, which was support in June). I prefer to short a break under the red line, which is former resistance turned support. As long as price is above that line, a ‘surprise’ rally is possible. If price breaks, then the initial level of interest on the downside is 70.15. Watch for 74.30 resistance.
6/15 – AUDJPY found support near the bottom of the channel from the March low. The decline from last week’s high though is in 5 waves (with a truncated 5th wave) so I’m anticipating a corrective rebound. Resistance is either 74.90-75.18 or 75.88. The bottom of the zone is the 61.8% retrace, former support, and the 200 hour average. The top of the zone is the 78.6% retrace and underside of the center line.


