
Market Update 5/4 – NZDUSD Tags Key Level
BTCUSD 4 HOUR
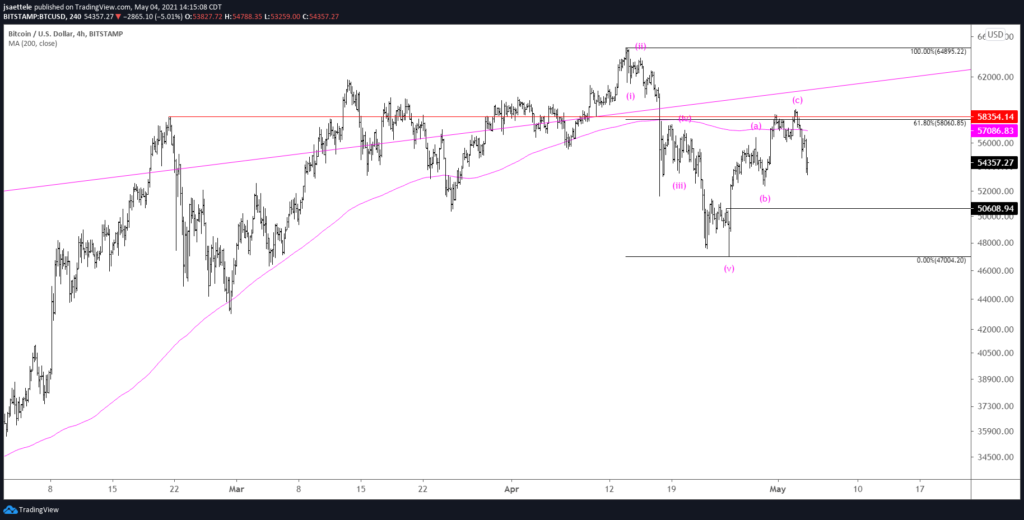
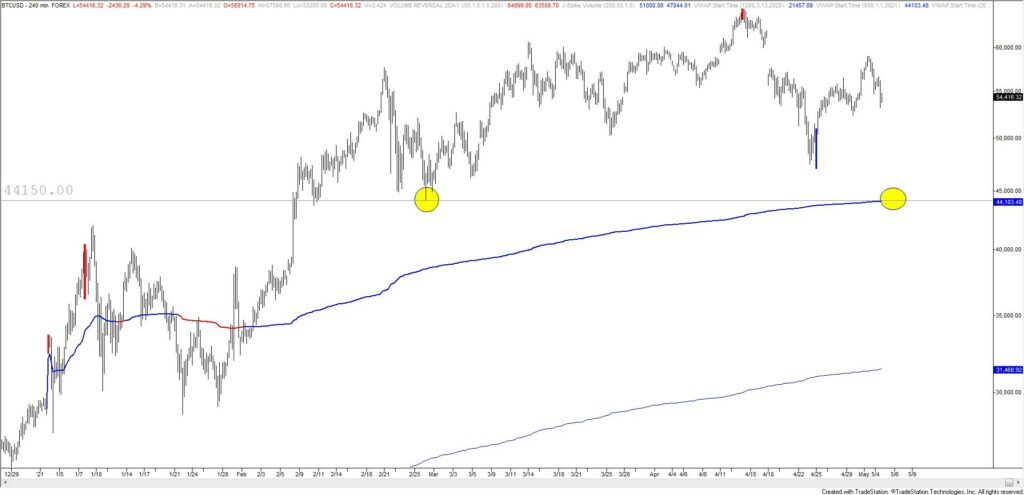
A 3 wave (A-B-C in Elliott) appears complete in BTCUSD which leaves price in the 3rd leg down of either a corrective or impulsive sequence. In either situation, lower prices are favored in the near term. The initial downside level to pay attention to is 44100. This is 2021 VWAP (see below) and the 2/28 low.
4/28 – The BTCUSD drop extended into 5 waves so my view is that this rally is corrective. Specifically, wave A of an A-B-C rally may be complete so allow for a B wave drop and then a final rally in wave C in order to complete the sequence. Levels to know are 50600 and 58000.
BTCUSD 4 HOUR
USDOLLAR 4 HOUR
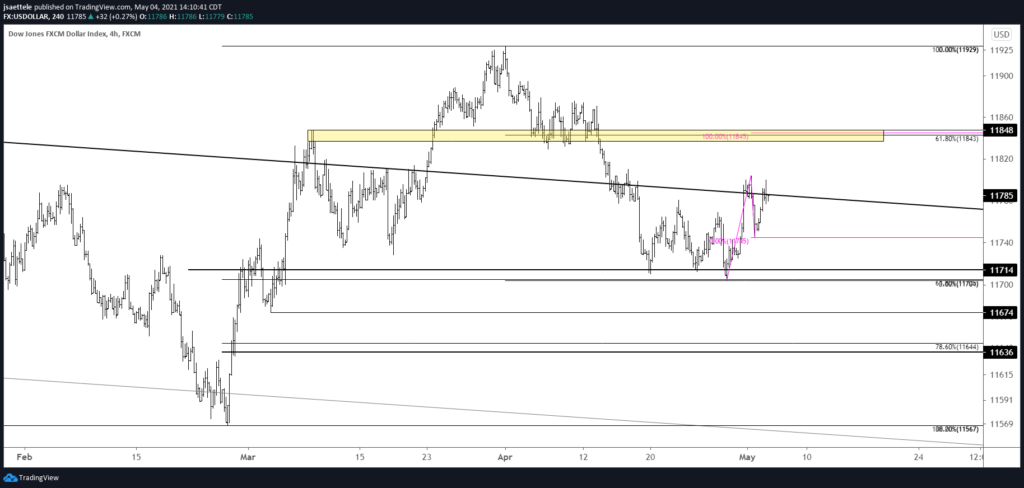
The latest USDOLLAR note (5/2) remarked on longer term observations. Near term, pay attention to 11840s. This is the 61.8% retrace of the decline from 4/1 and where the rally from 4/29 would consist of 2 equal legs. The 200 day average (not shown) is just above there as well.
5/2 – USDOLLAR has completed a DeMark weekly sequential buy countdown. This is the 3rd such bullish signal since inception of the index (which I helped develop). The other 2 signals nails lows in February 2012 and January 2018. Another piece of USD bullish information is shown below. Relative growth forecasts against G9 currencies is extremely bullish for the buck.
EURUSD 4 HOUR
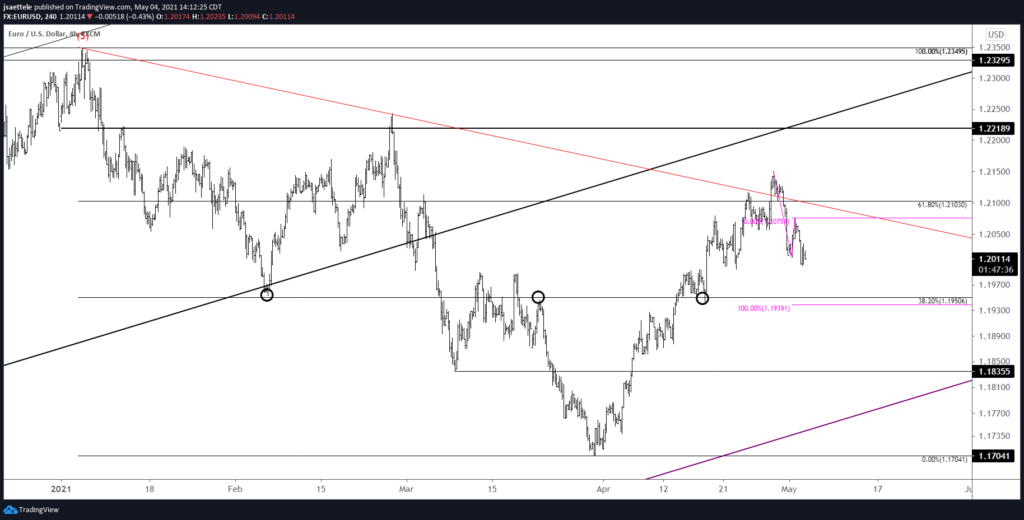
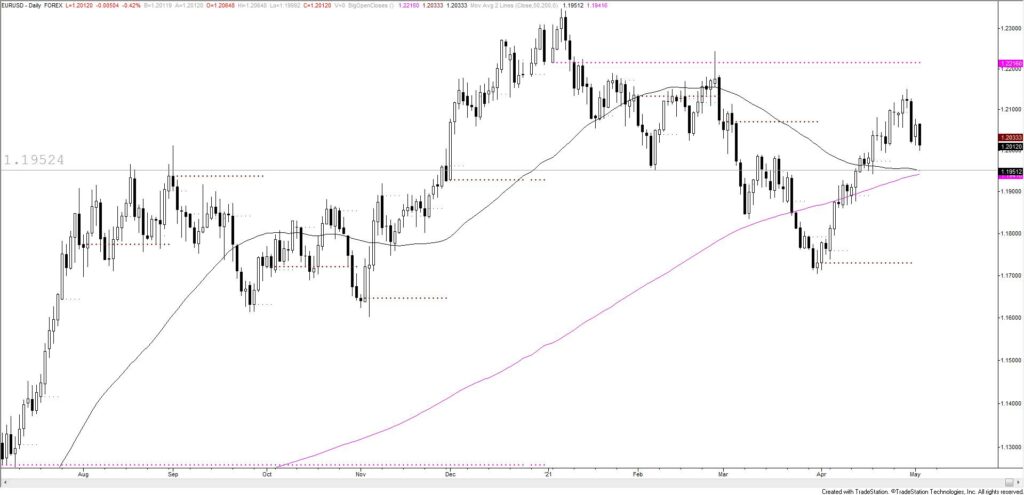
EURUSD continues to pull back. As long as Monday’s high remains in place, the next decision point is 1.1950. The market deems the level important (clear horizontal level). It’s also 2 legs down from the high and near the 38.2% retrace of the rally from 3/31. Finally, the 50 and 200 day averages converge at 1.1950 (see below).
5/3 – EURUSD is in the exact opposite position as DXY. Price turned sharply lower on Friday but gave back a good portion of those losses today. The decline counts in 5 waves (impulsive) which suggests at least one more leg down while price remains below Friday’s high. 1.2100 is proposed resistance if reached.
EURUSD DAILY
USDSEK 4 HOUR
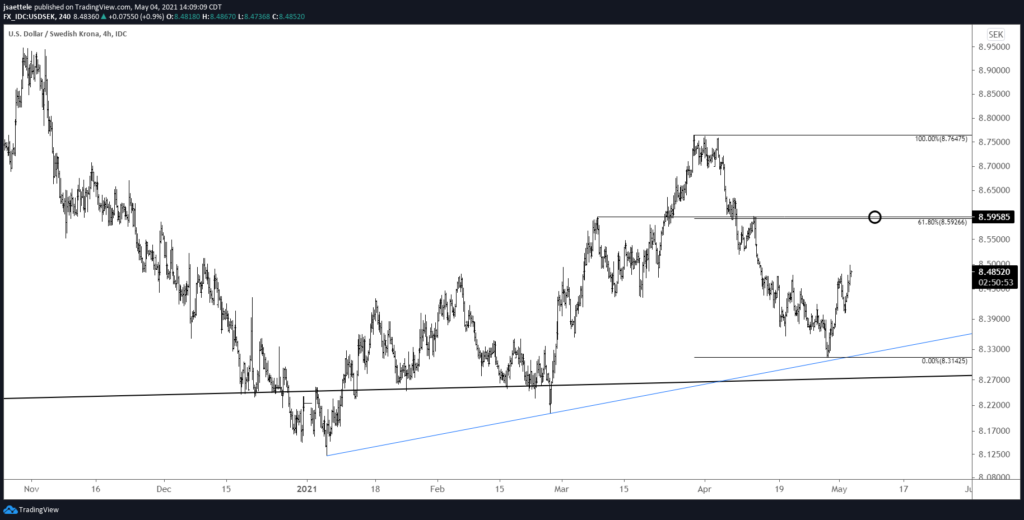
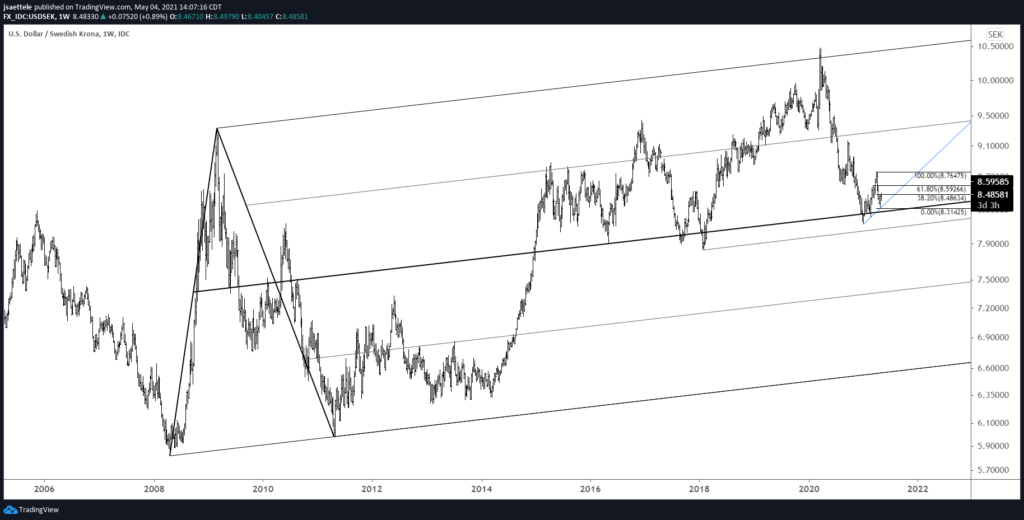
I don’t trade it much, but USDSEK often offers clues regarding important USD levels and/or reversals (notably divergences with DXY or EURUSD). USDSEK has turned up from near the center line of the channel that originates at the 2008 low. Bull moved originates from the center line or nearby in 2016, 2017, and 2018 (see below). Is it happening again? I don’t know but I am bullish until at least 8.5900s (next decision point).
USDSEK WEEKLY
NEW ZEALAND DOLLAR FUTURES HOURLY
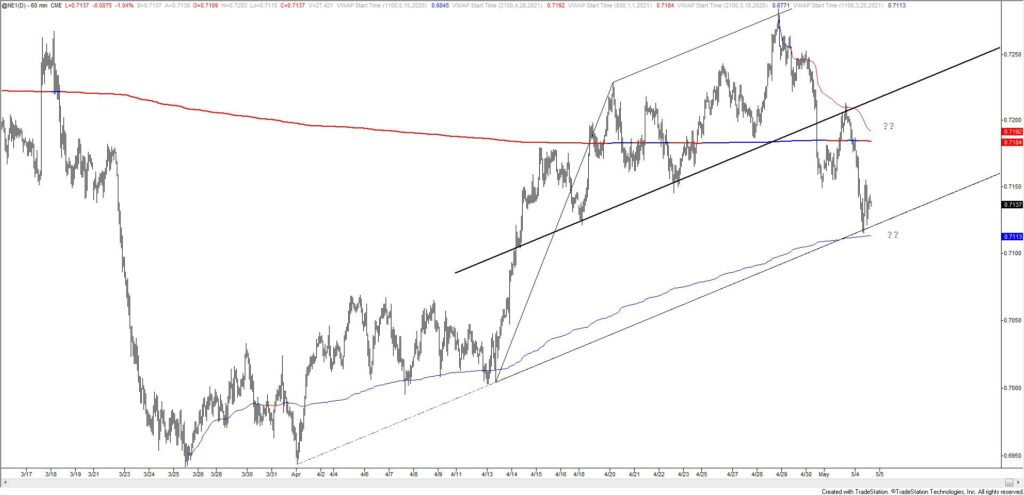
Kiwi has traded in a textbook fashion over the last week or so. Resistance at the channel high…hard break of the center line…center line acting as resistance…and finally the lower channel line holding. Price has also nearly reached VWAP from the April low. I’m showing the futures chart today in order to show the VWAP levels (futures price is basically spot right now anyway). It’s tempting to flip from bear to bull right here but recall that seasonal tendencies are bearish through May. As such, allow for additional information before taking a stand. Flat is a position too. If price does bounce here, then .7190s is in line for resistance (VWAP from the April high and 2021 VWAP). If price breaks below the current level, then the underside of the channel line becomes proposed resistance to re-short.
5/3 – NZDUSD has traded into proposed resistance from the short term channel center line at .7200. This line was support for several days in mid-late April. Former support turned resistance? We’ll see. Downside focus remains the lower channel line near .7120. A break below there would suggest something more bearish. Seasonal tendencies are bearish for most of May (see below).


