Market Update 1/27 – USD Breakout!?
S&P 500 FUTURES (ES) 4 HOUR

ES finally broke the wedge that I noted 2 weeks ago. The underside of the former wedge line should be resistance now near 3788. Near term downside objectives are the 11/9 spike high at 3668 followed by the well-defined 3590. Longer term downside potential is SIGNIFICANT. A drop below the long term magenta parallel (see the next 2 cash charts) would be the trigger for a ‘waterfall’ decline.
1/14 – The latest AAII bullish sentiment reading is elevated. High levels of bullish sentiment tend to occur near price tops. On the chart, I’m paying attention to a short term wedge pattern (see below) in SPX. The lower wedge barrier is about 3715. A break below is needed in order to suggest a larger reversal is underway.
SPX DAILY

SPX WEEKLY

COPPER FUTURES 4 HOUR

Copper is nearing the lower parallel from the channel off of the March low. That line is about 3.5055. A break below would indicate an important behavior change and shift focus to the channel extension, which is roughly 3.12-3.21 over the next few weeks.
1/18 – Copper has been oscillating around the 61.8% retrace of the decline from 2011 for just over a month. Near term, price has reacted from the underside of the channel center line from the March low. This is a minor behavior change but worth noting. As long as price is under the center line, focus is lower towards the lower parallel near 3.45.
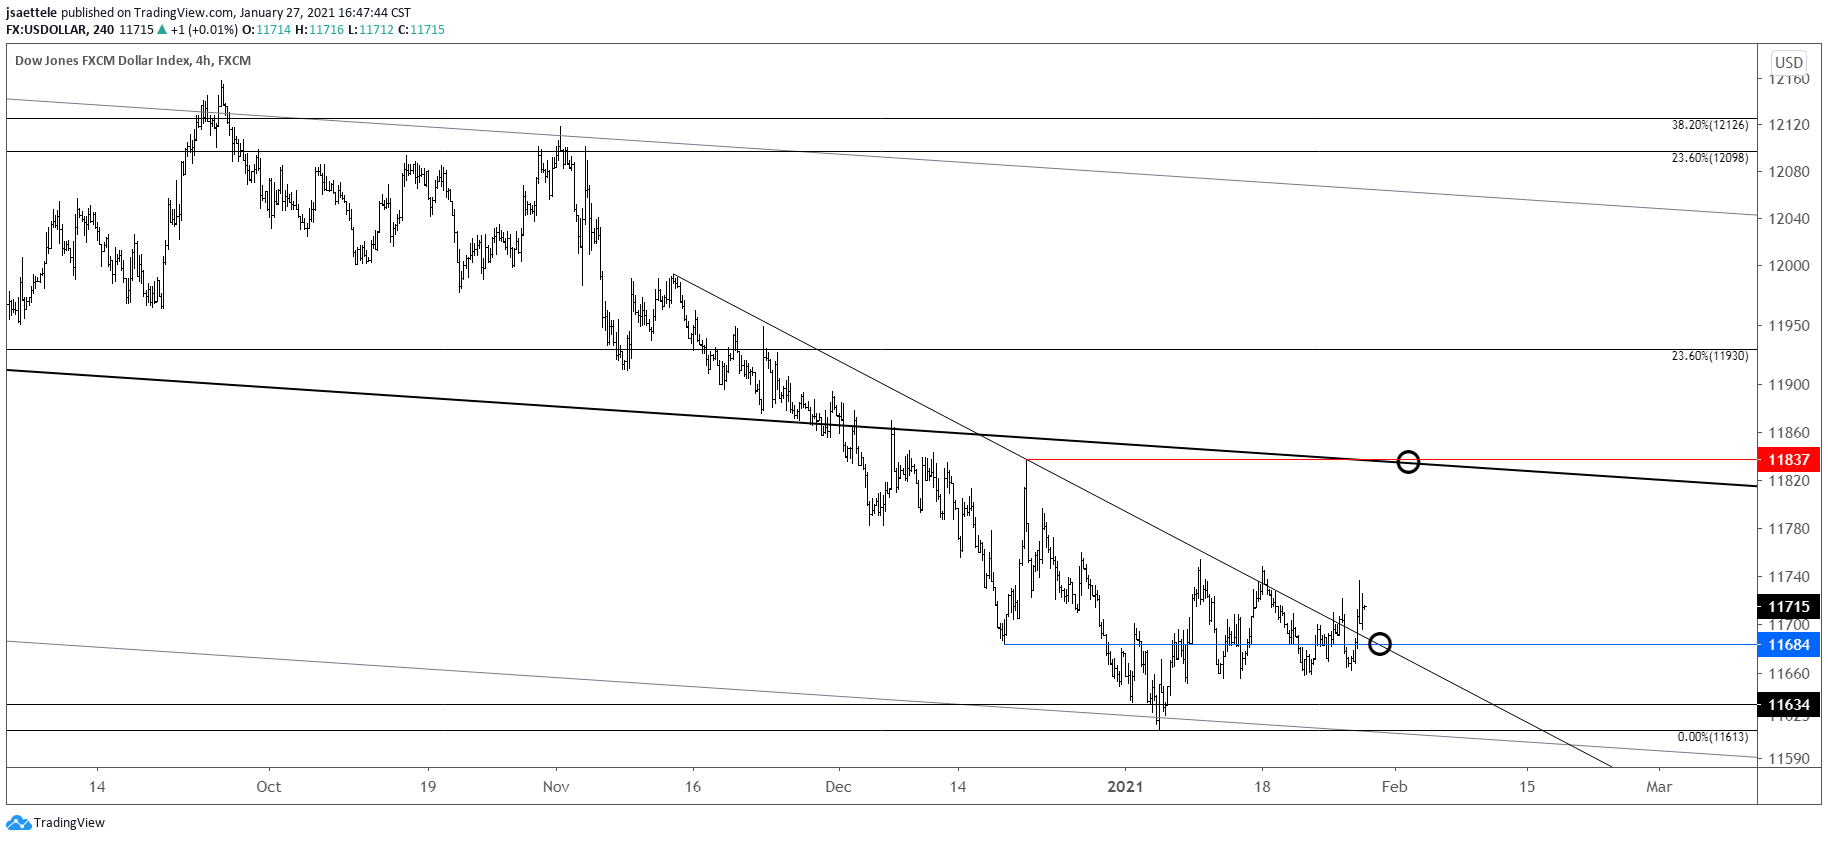
USDOLLAR 4 HOUR

USDOLLAR (quarter each of EUR, GBP, JPY, and AUD) has broken above the trendline that originates at the 11/12 high. The top side of that line is now proposed support near 11684. Upside focus is the 12/21 high at 11837. The level is reinforced by the median line from the fork that originates at the January 2017 high. A longer term chart is shown below for context.
USDOLLAR DAILY

AUDUSD DAILY

Action since the AUDUSD high constitutes a running wedge. Price is testing the lower parallel from said wedge now and a break below would lead to accelerated weakness towards .7550s and then the September high at .7413. If price does break below the wedge line (magenta line), then the underside of the wedge line becomes resistance and I’d look to add to shorts on a re-test of that line from below.
1/24 – AUDUSD is testing the median line from the Schiff fork that originates at the March low. This is a key spot. A break below would indicate an important behavior change and immediate focus would be the lower parallel of the short term bearish channel at .7642. In the event of a break below, the underside of the median line would become proposed resistance.
USDCAD DAILY

USDCAD has broken higher from a short term wedge (Elliott traders would call this an ending diagonal). Immediate focus is the origin of the wedge at 1.2950. The top side of the former wedge line (blue line) is now support for longs near 1.2715.
1/25 – USDCAD is testing the line that connects the March and September highs. This line provided resistance in November, December, and January so a break above would indicate an important behavior change. If price pulls back a bit then watch for support near 1.2684. If price accelerates higher from the current level then look to buy a pull back into the top side of the current resistance line (see hourly chart below).


