Market Update: January 26
ASSET ALLOCATION TO COMMODITIES
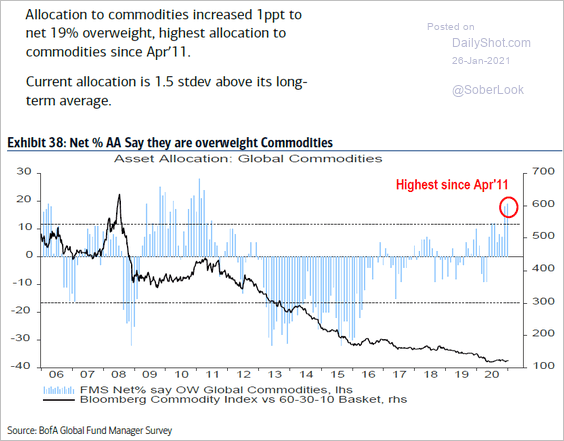
Fund manager’s allocation to commodities is the highest since April 2011. I find this worrisome for the ‘reflation trade’ given that April 2011 was the the final commodity high before the deflationary period. Long commodities is essentially short USD so chalk this up as another ‘reason’ to suspect a ‘surprise’ USD rally.
DON’T WORRY – NO BUBBLE HERE

Fear only the fear of a bubble. In other words – “if you see a bubble – ride it”. One day (very soon) we will look back at this period and wonder why we did not short the hell out of this market.
DJIA MONTHLY
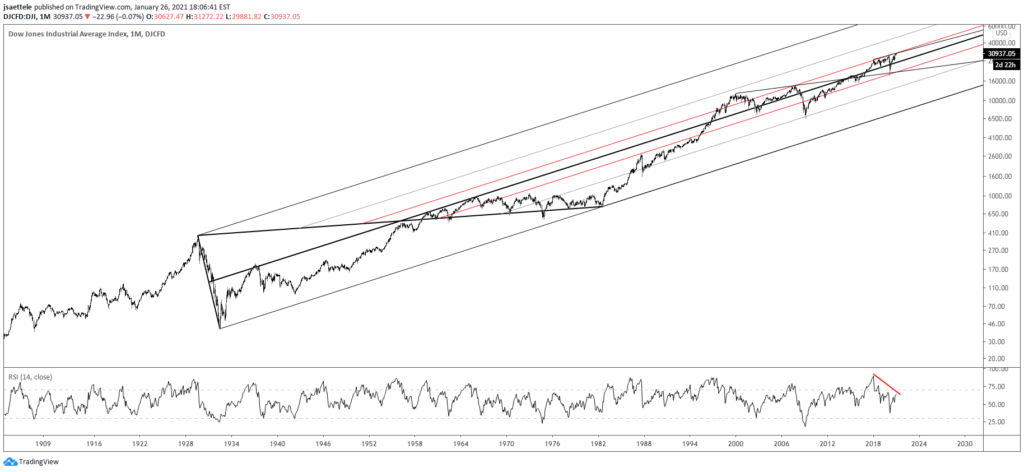
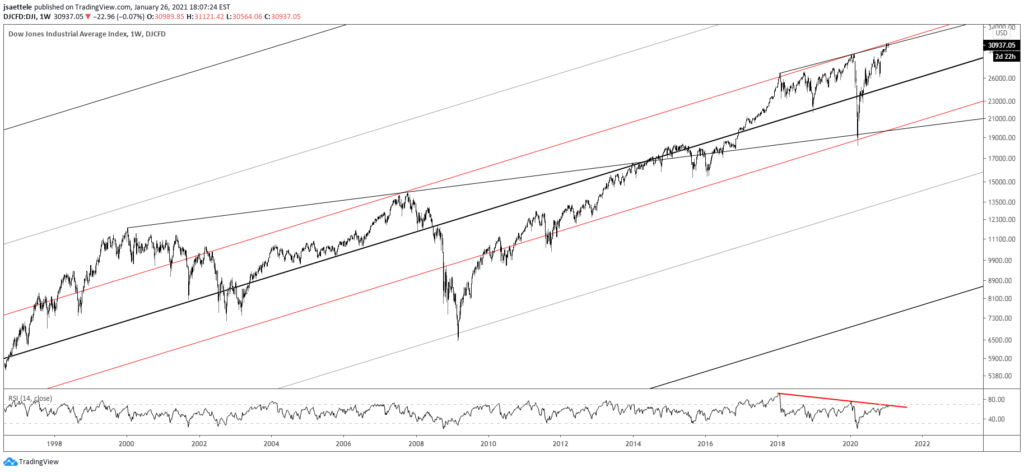
The longest term chart that I follow is the Dow Jones Industrial Average since the early 1900s. The average channels beautifully and price has been pressing against the parallel that nailed the 2007 top since January 2018 (3 years!). Divergence with RSI is present on the monthly and weekly. A weekly is shown below.
DOW WEEKLY
DXY 4 HOUR
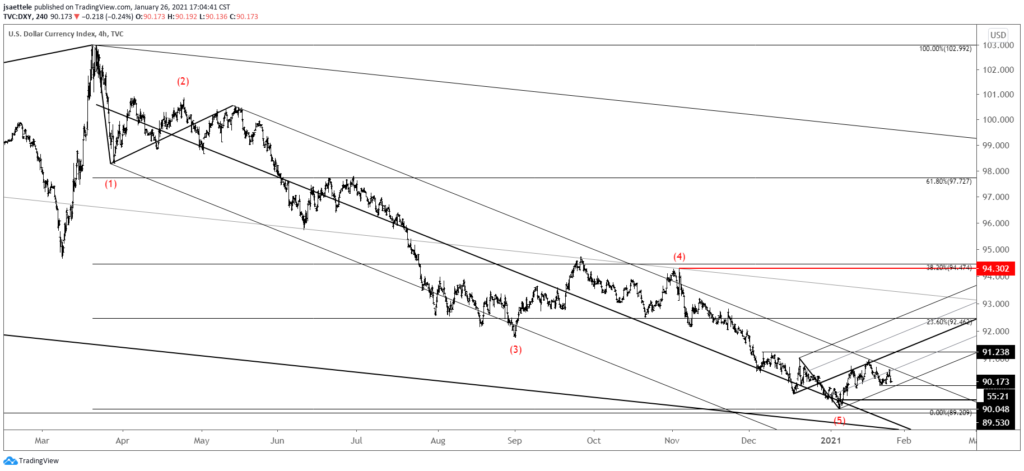
The line in the sand for DXY is clearly the upper parallel of the Schiff fork from the March high (along with the 50 day average…not shown). Price ideally holds 90 in order to maintain the short term bullish fork.
121 – DXY is nearing the noted 61.8% retrace of the rally at 89.87. The level is also defined by the lower parallel of the short term bullish fork. If this level doesn’t hold, then there is no reason to be constructive DXY. The COT chart below shows that speculative short positions are their largest since 2007 (there are a couple hundred more short positions now than at the 2011 low).
EURUSD HOURLY
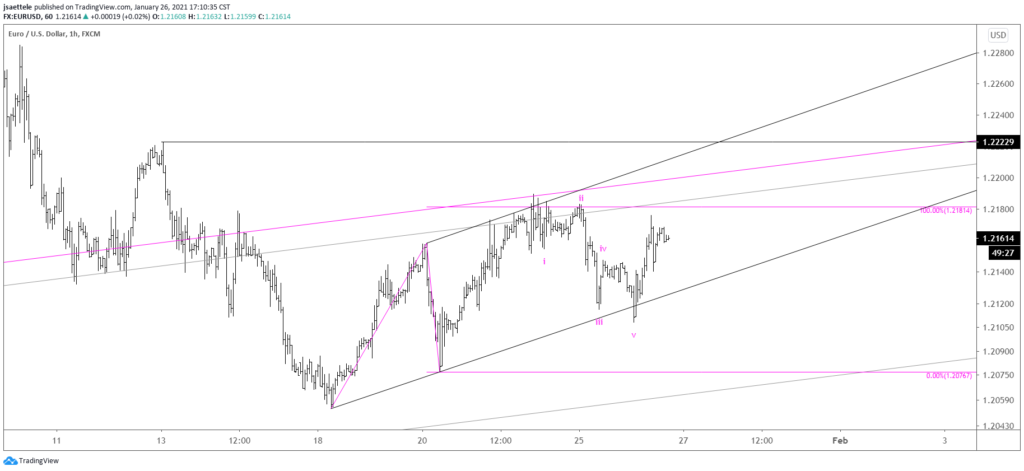
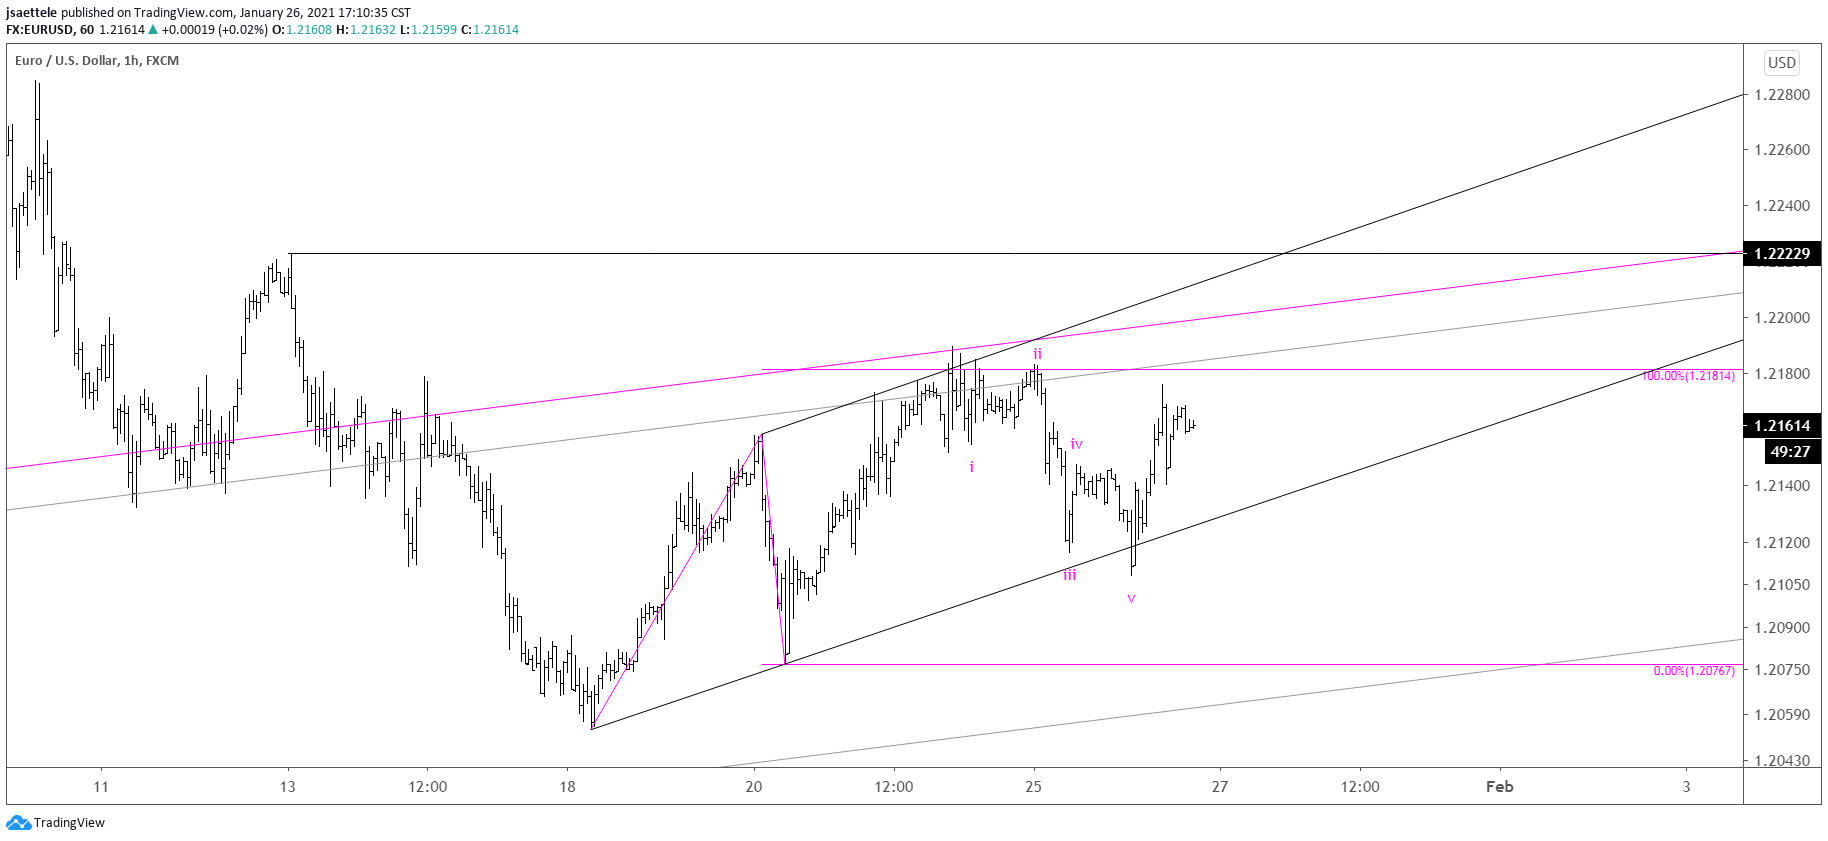
The drop from Friday’s high in EURUSD is a clean 5 waves. The implication is that price declines below 1.2108 while staying below 1.2190. Consider that the noted 5 wave decline occurred after a perfect corrective channel and a turn lower from resistance (see below) and there is good reason to be bearish against 1.2190.
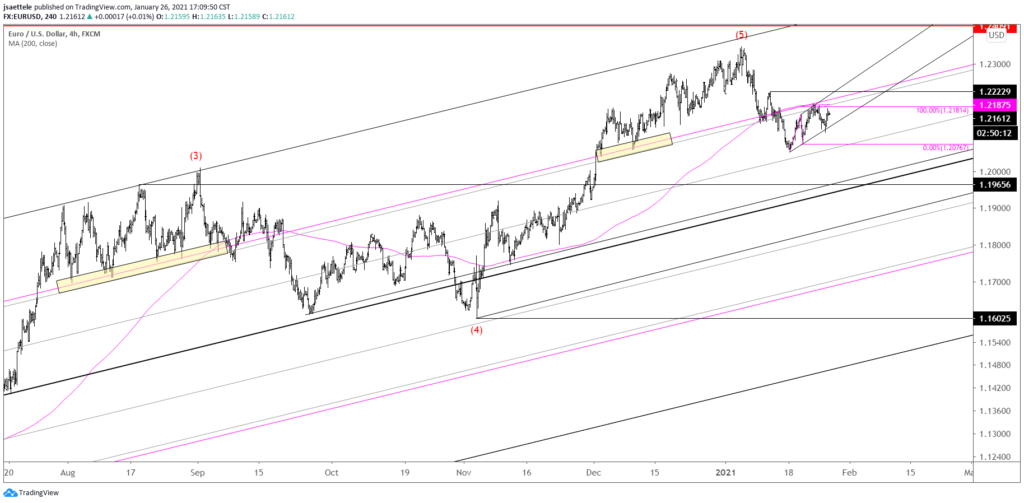
1/21 – EURUSD is nearing the mentioned 1.2180s. The rally from this week’s low would consist of 2 equal legs at 1.2181. The spike during ECB today tested the upper parallel of the corrective channel. A zoomed out chart is shown below and the futures chart with VWAPs are 2 charts down. The VWAP levels reinforce proposed resistance at the noted level. If EURUSD is going to turn down then there is no better spot than from 1.2180s (give or take).
EURUSD 4 HOUR
USDSEK 4 HOUR
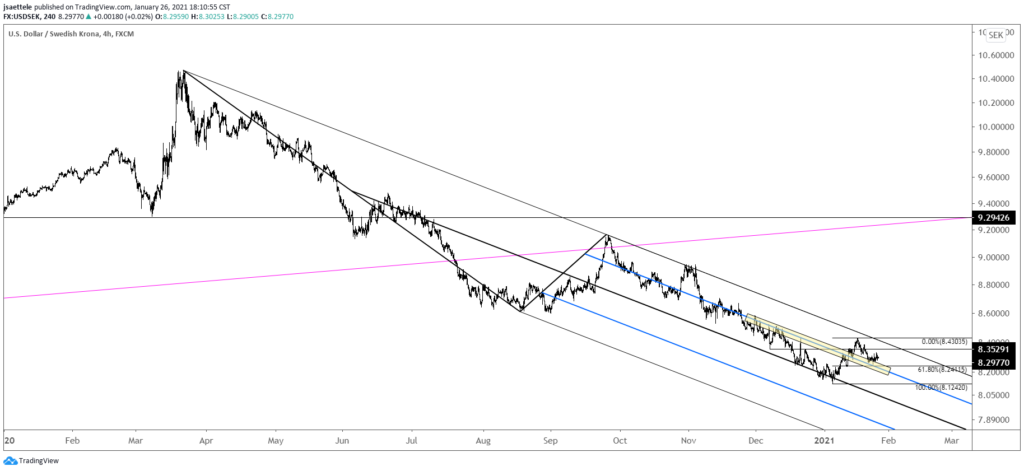
Maybe the Scandis are offering clues regarding the bigger picture for the USD? USDSEK remains within a bearish channel from the March high but is nearing possible support from both the 61.8% retrace of the rally and a parallel that was resistance for several months (highlighted). Like DXY and EURUSD, there isn’t much room for error…either the USD turns up here or ‘who knows’.

