Market Update 8/24 – USDCAD Support?
DXY 4 HOUR
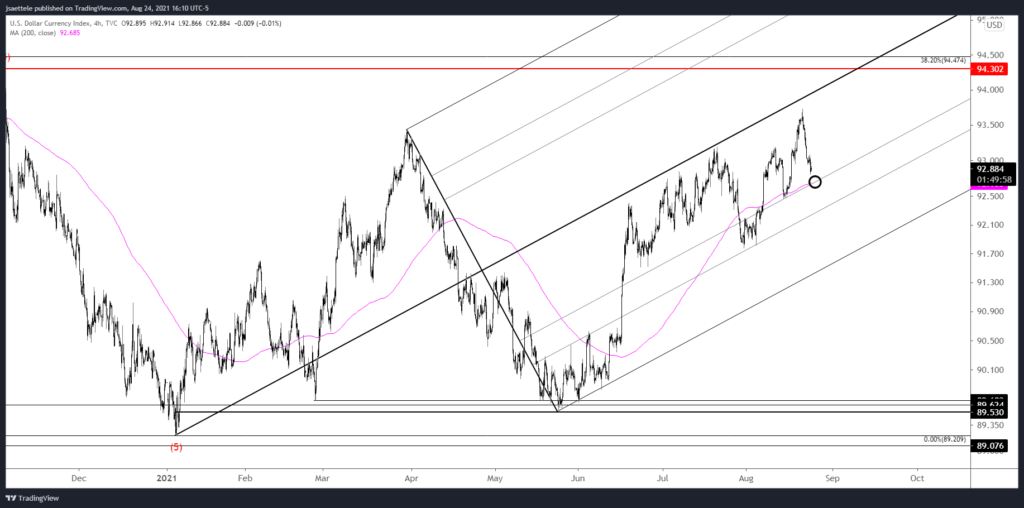
DXY is fast approaching the 25 line within the structure that originates at the January low. This line was precise support on 8/13. I’m on the lookout for support at the level (about 92.70) again but probably only for a corrective bounce. USD weakness in general appears impulsive which means that at least a 3 wave drop is probably underway.
GBPUSD HOURLY
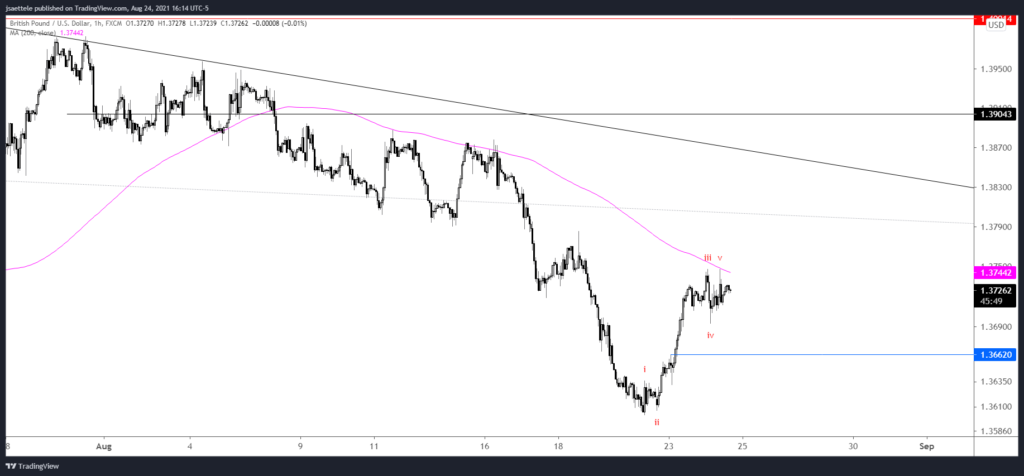
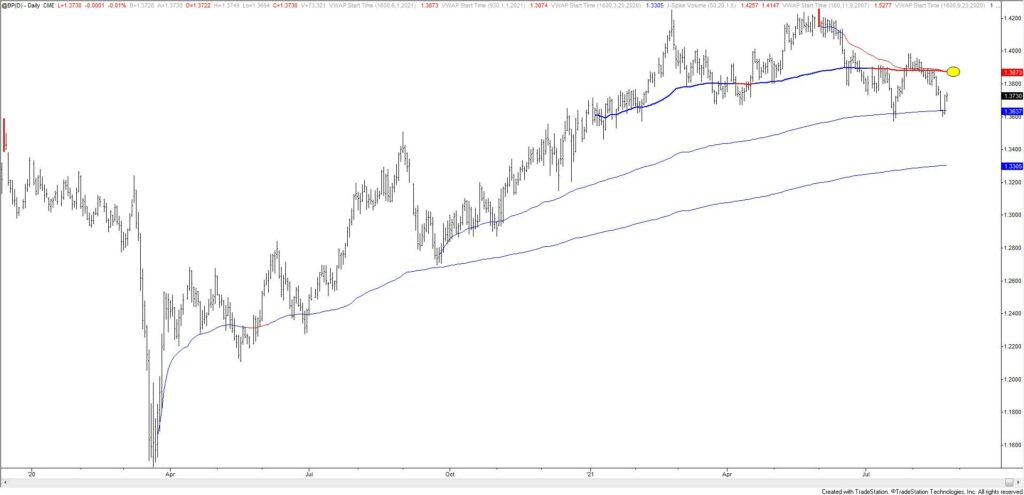
Impulsive action is clearly visible in GBPUSD. This is a good spot (200 hour average) for a pullback. If that happens, then I’ll be on the lookout for a higher low against last week’s low)…maybe near 1.3660. Eventually, the upper parallel that was resistance in late July/early August will be in line for resistance near 1.3860. This level is reinforced by VWAP from the YTD high and 2021 VWAP (see below). Also, notice how price held VWAP from the September low yet again!
BRITISH POUND FUTURES DAILY
NZDUSD 4 HOUR
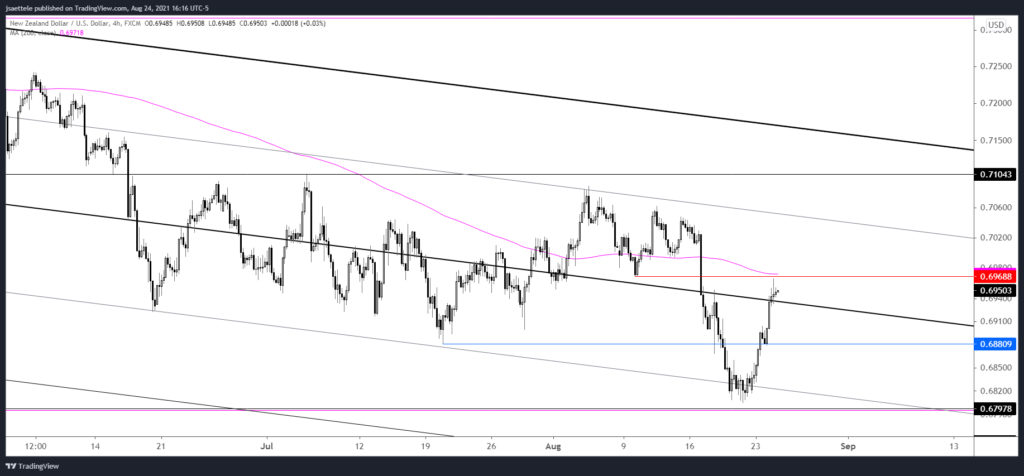
Kiwi is already into .6960s! The month open is .6966, which is also the 8/10 low. I’m ‘thinking’ pullback from this level. If that happens, then .6880s (7/20 low) would be a candidate for support. Obviously, some sort of a sign is needed in order to attempt a short position (hourly key reversal for example) but this level is well-defined for short term resistance.
8/23 – NZDUSD bottomed 5 ticks above .6800 (VWAP from March 2020 low…see below)! Again, price continues to oscillate between the 25 and 75 lines of the channel from the February high. Immediate focus for resistance is the median line near .6935. Watch for support near .6860.
USDCAD DAILY
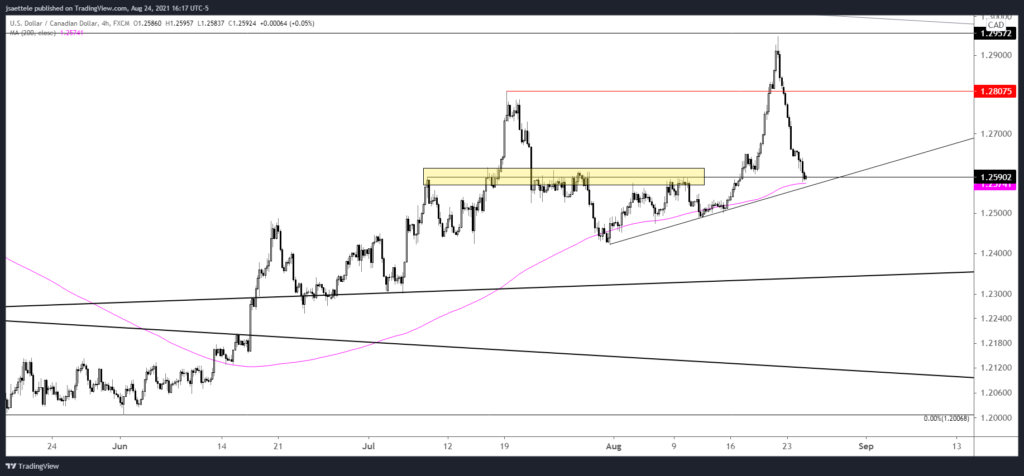
USDCAD is into former resistance at 1.2590. The line that crosses lows since 7/30 is about 1.2575. If a bounce were to materialize from the current level then the 61.8% retrace of the decline would be 1.2807…the exact same level as the 7/19 high. Bottom line, I’m looking for a bounce now.
8/23 – High last week was 1.2949. Close enough? The drop appears impulsive so focus will be on identifying resistance following a rebound. 2 levels to keep in mind are the year open at 1.2721 and the 7/19 high at 1.2808. Watch for a bounce near 1.2589-1.2605 (former resistance).


