Market Update – July 30
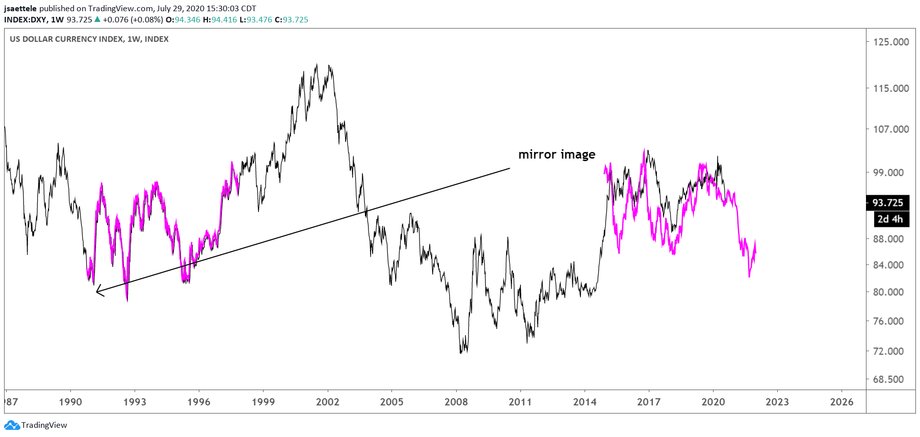
DXY WEEKLY
This is an analog that we’ve been following for several years. The mirror image of DXY price action from the February 1991 low closely matches price action from the March 2015 high. Figure out ‘why’ if you want but it continues to ‘work’ and I’m intrigued because the analog suggests consolidation through year end before the USD takes a digger in 2021. A close-up view is below.
7/28 – USD Index futures have reached VWAP from the 2018 low (slipped slightly below actually). I’m especially interested to see where this closes the week and month. The long term VWAP reinforces the long term channel as a level of importance.
DXY DAILY

GBPUSD DAILY

Cable has reached the median line from the structure off of the September low. This is the 3rd test so be aware of potential for median line acceleration. In that event, the next level of interest is 1.3200. I’d love a pullback to 1.2700 (see daily chart below). We may get it because price has reached VWAP from the 2018 high (see 2 charts down). For those that think longer term anchored VWAPs aren’t valuable, check out the VWAP line from the 2014 high on the same chart.
7/22 – GBPUSD still looks great. I am concerned about USD sentiment but risk is today’s low, which is well-defined and small. The April (1.2648) was resistance earlier this month and was support today. Price also closed over the 200 day average today. I like both of those things. The high volume level from today at 1.2675 and 200 day average at 1.2698 provide a range for support. Upside focus is the median line, currently near 1.2975.
GBPUSD DAILY

BRITISH POUND FUTURES DAILY

USDCNH DAILY

BIG spot for USDCNH, which tagged the line off of the April 2019 and January 2020 lows last week and continues to hold up. This is also the January 2017 high. What if everything since August 2019 was consolidation / re-test of the breakout level? As long as this level holds, that’s a possibility.
USDNOK DAILY

Just about there for USDNOK. The lower Elliott channel is now about 8.95. The January 2016 high is 8.99. I’m looking for a reversal attempt within that zone.
7/21 – I love this USDNOK chart. Price has reached the trendline from the September 2018 low. If price slips a bit further, then the Elliott channel from the 2013 low comes into play near 8.92. Again, big level in a USD cross! Also, the decline from the March high is clearly in 5 waves.


