Market Update: February 2
COPPER 4 HOUR
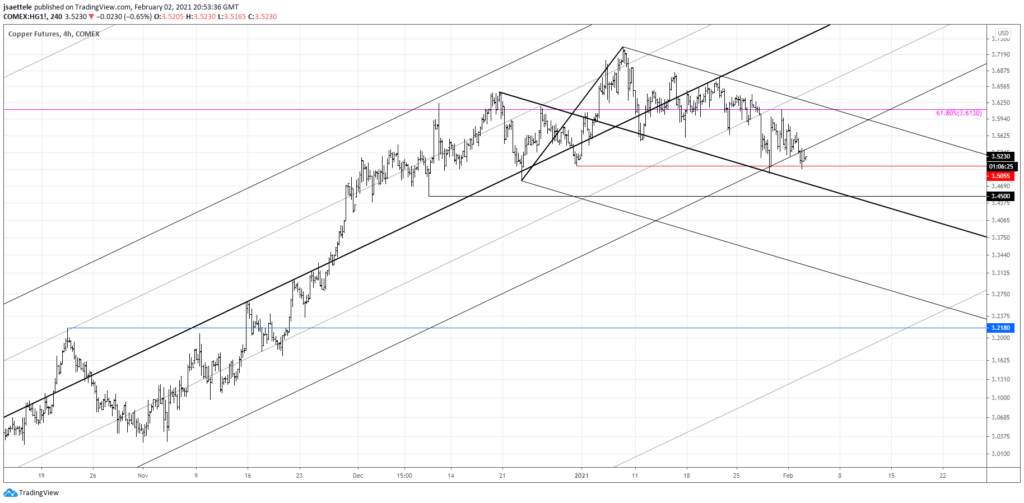
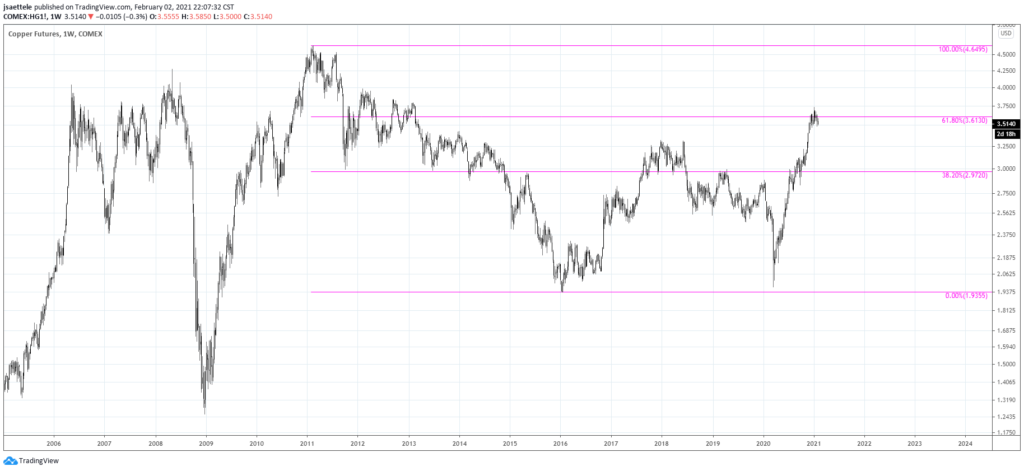
The copper bounce failed and price is just under the trendline from the March low. The trendline is extremely steep. Generally, the ‘steepness’ of the trendline and associated break correlates with the reliability of the break. In this instance however, copper sports a 7 week topping pattern and price has been oscillating around the 61.8% retrace of the decline from the 2011 high (see weekly chart below). I’m bearish towards 3.2180.
1/28 – Copper bounced sharply from the noted channel line and has encountered the underside of the 200 period average on the 4 hour chart. This average was precise support in October and November…just before the big rally. Support turned resistance? (it works for averages too) Bottom line, keep an eye on copper because a break below the lower parallel would indicate a major change in the ‘inflation trade’.
COPPER WEEKLY
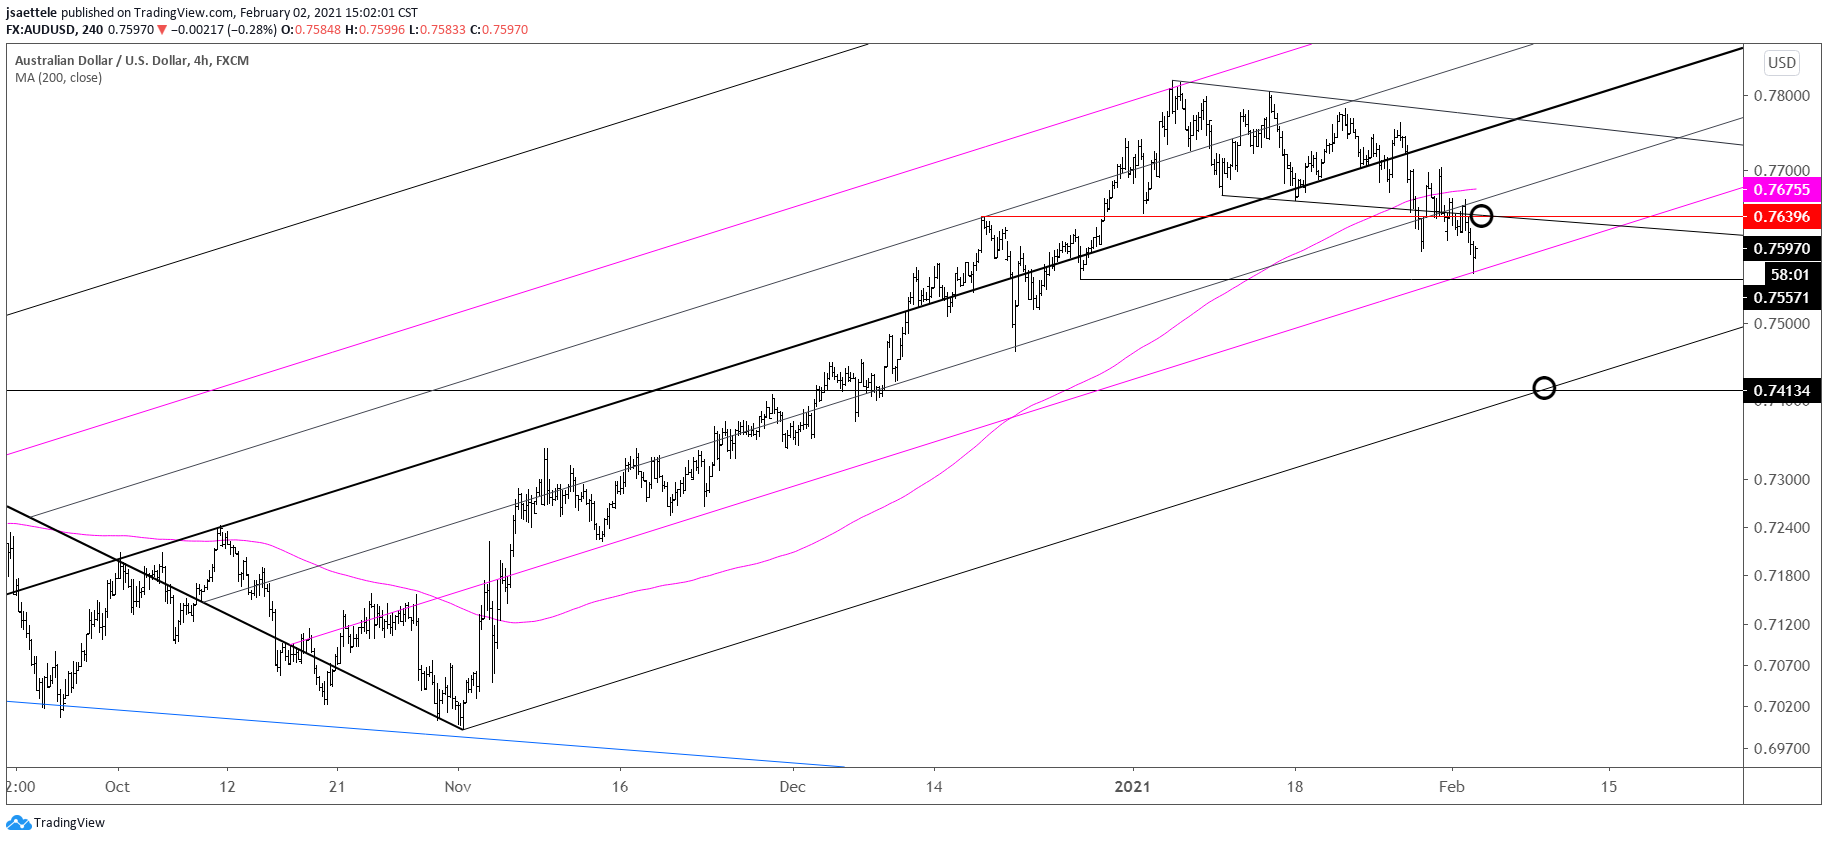
AUDUSD 4 HOUR
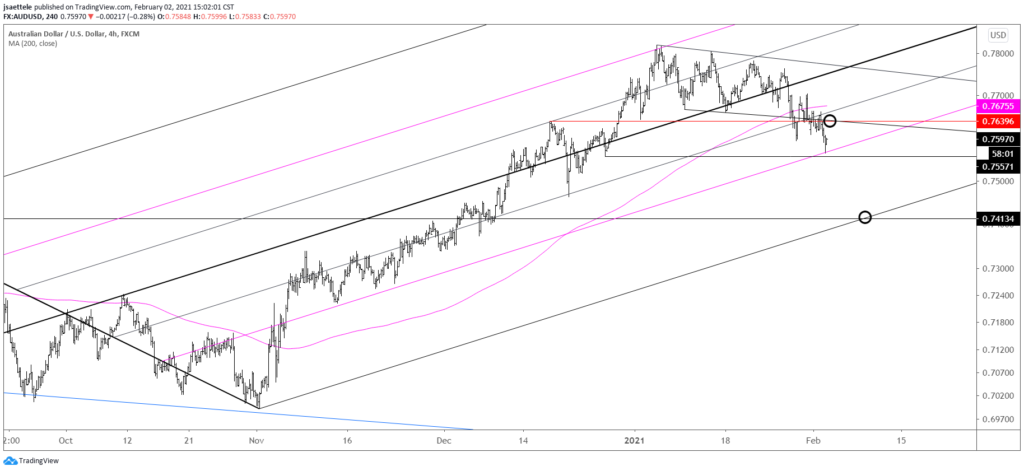
AUDUSD responded to the 25 line of the Schiff fork from the March low. Recall that price topped at the 75 line (75 and 25 lines are magenta)…a perfect example of median line symmetry! Focus remain towards the lower parallel near .7413. Proposed resistance is .7640.
1/31 – Near term AUDUSD focus remans .7550s and the lower parallel of the Schiff fork from the March low. This line crosses the September high at .7413 early next week. Risk on shorts is Friday’s high at .7704. Strength above there would face possible resistance from the median line again near .7740.
USDTRY DAILY
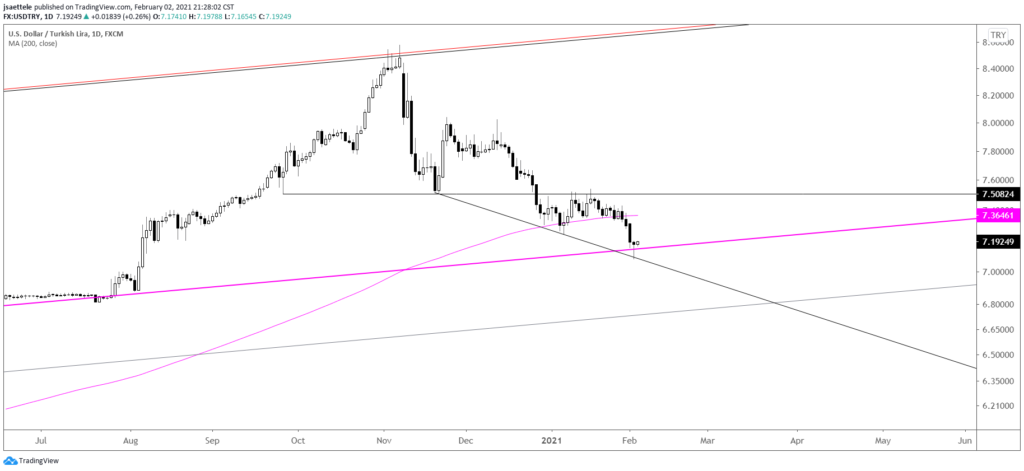
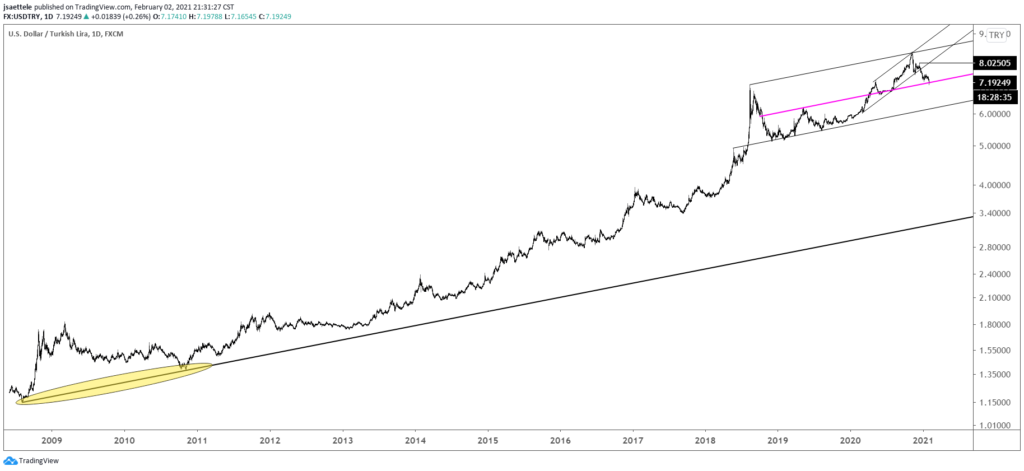
USDTRY reversed higher today following a tag of the line off of the November and January lows. The level is also defended by a parallel that relates to original slope. In this instance, original slope is the line that connects the 2008 and 2010 lows (see zoomed out chart below). Bottom line…a bounce here would ‘make sense’.
1/21 – USDTRY didn’t quite make it to 7.56 but price is respecting the bearish channel perfectly so I’m going to leave a short order on the downward sloping trendline, which is near 7.4380. A downside objective is where the decline from the top would consist of 2 equal legs from the top at 6.9765.
USDTRY DAILY
GBPAUD WEEKLY
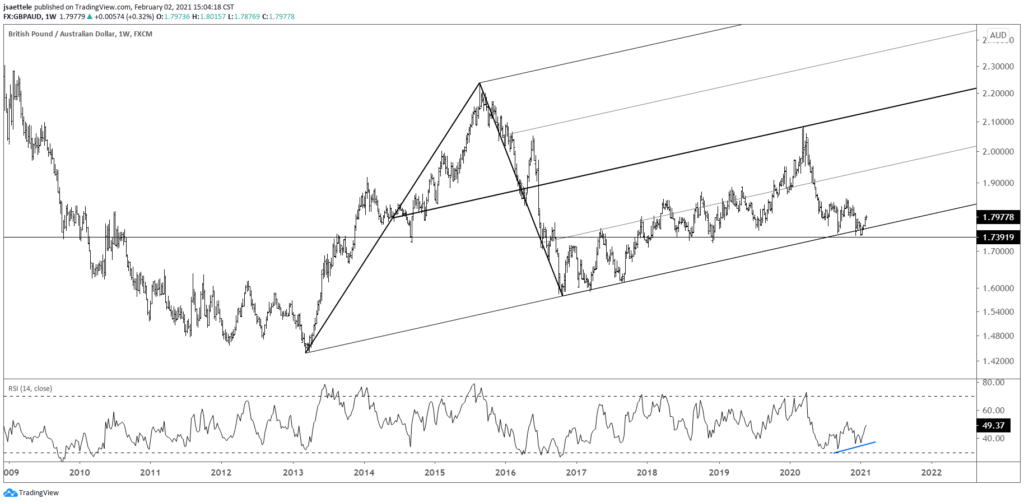
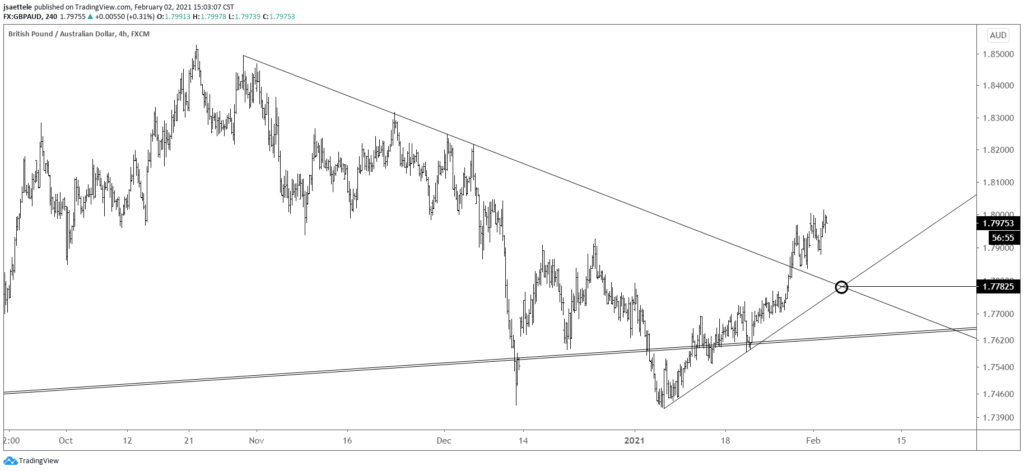
GBPAUD has turned up from an 8 year trendline. Weekly RSI is divergent with price at the low which indicates potential for an important turn. Watch for support near 1.7780 (see 4 hour chart below).
GBPAUD 4 HOUR
