Market Update: October 26
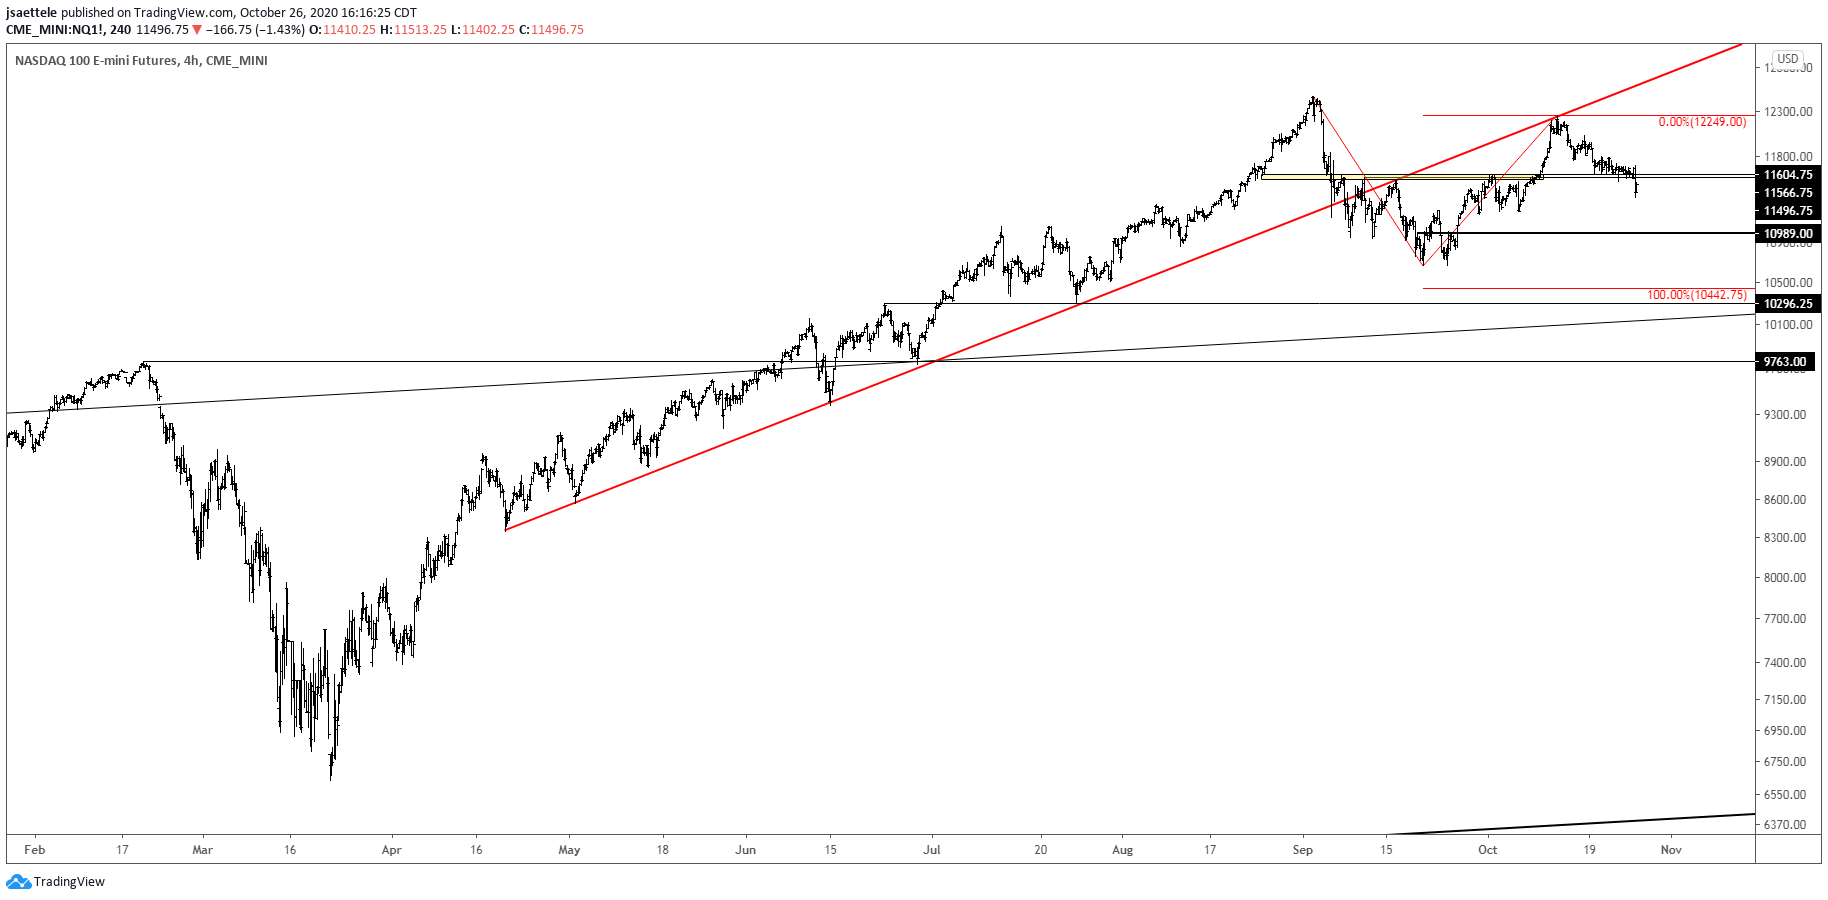
NASDAQ FUTURES (NQ) 4 HOUR

I’m treating the area around 11600 as near term bull/bear dividing line for Nasdaq futures. As long as price is below this level, I am looking lower. 10989 is a level to be aware of within the range with broader focus on 10300-10442. This is the 7/24 low and 2 equal legs down from the September high.
COPPER FUTURES 4 HOUR

Copper high last week was right at the line that crosses off of the July and September highs. Parallels to this line form a channel and provide levels to pay attention to on a near term basis. 3.0465 is a possible bounce level. A break there opens up the more important test at 2.9205. Tactically, I’d look for a failed bounce from the former level to target the latter.
EURUSD HOURLY

As noted yesterday, below 1.1740 would trigger shorts but there may be an earlier signal. Notice how the center line of the channel from the September low has been a near term pivot. Price is testing the line now. In the event of a break below, watch for the line to provide resistance…probably near 1.1815. A schematic is outlined with magenta lines.
10/25 – EURUSD tagged the median line from the fork that originates off of the 2015 low. The implication is twofold. One, a temporary ceiling is in place. Two, support likely registers on the same angle. In this case, the 25 line was resistance and is now proposed support. The line is currently about 1.1460, which is in line with the March high at 1.1495. Below 1.1740 or so is the short trigger (see below).
USDJPY 4 HOUR

USDJPY traded into 105.00 and turned lower. That said, volatility is dead. Bollinger Band width for example recently registered its lowest reading since 1976! Risk is tiny so it’s worth a shot at the short side against today’s high. Price has been sitting on a critical long term level (see weekly chart below) since July. How many times can this level be tested before it breaks? Interestingly, a break would expose the 2016 US Election low from 2016.
10/25 – My view is that USDJPY completed a B wave triangle in 2020 and that wave C lower is underway towards 93.80-94.80. This zone includes the June 2013 low and 61.8% retrace of the rally from the 2011 low. Near term resistance is 105.00ish (see below).
USDJPY WEEKLY

AUDUSD 4 HOUR

AUDUSD high on Friday was right at the 61.8% retrace of the decline from 10/9 at .7158 (which is also the month open). This is a great spot for a lower high within the sequence of lower highs since 9/1. Still, a final spike into trendline resistance near .7175 isn’t out of the question. In order to short, I need either a spike into .7175 and reversal or a break under .7030. Everything between those 2 levels is a waste of time.
10/25 – Current AUDUSD price behavior is similar to that of 2002. In both instances, price traded outside of the long term channel before dropping back into the channel. If this continues, then AUDUSD comes back to .6700-.6800 (200 day average and 25 line within the channel…just like 2002) or so before finding the next low. Seasonal tendencies are bearish through late November.


