Market Update 10/27: U.S. Election Preview
In case you haven’t heard, there are elections (president, congress, senate) in the U.S. next Tuesday, November 3rd. Do markets, notably the U.S. Dollar, tend to trade a certain way before and after U.S. presidential elections? In an attempt to answer this question, I plotted DXY in the 3 months leading up to and one month after every election since 1972 (blue for a Democratic win and Red for a Republican win). Each time series is compared to current DXY (in black). The vertical black line indicates election day. You’ll find these charts at the end of this report.
DXY does tend to rally the month after the election, regardless of which party wins. Current pattern was closely tracking 1980 up until the last few weeks and now actually looks more similar to 2016. 1976 is also interesting, especially from a longer term perspective. Patterns in EURUSD, USDJPY, gold, AUDUSD, and crude oil compare favorably with 2016. I’ll look at each below before sharing the longer term comparison with 1976.
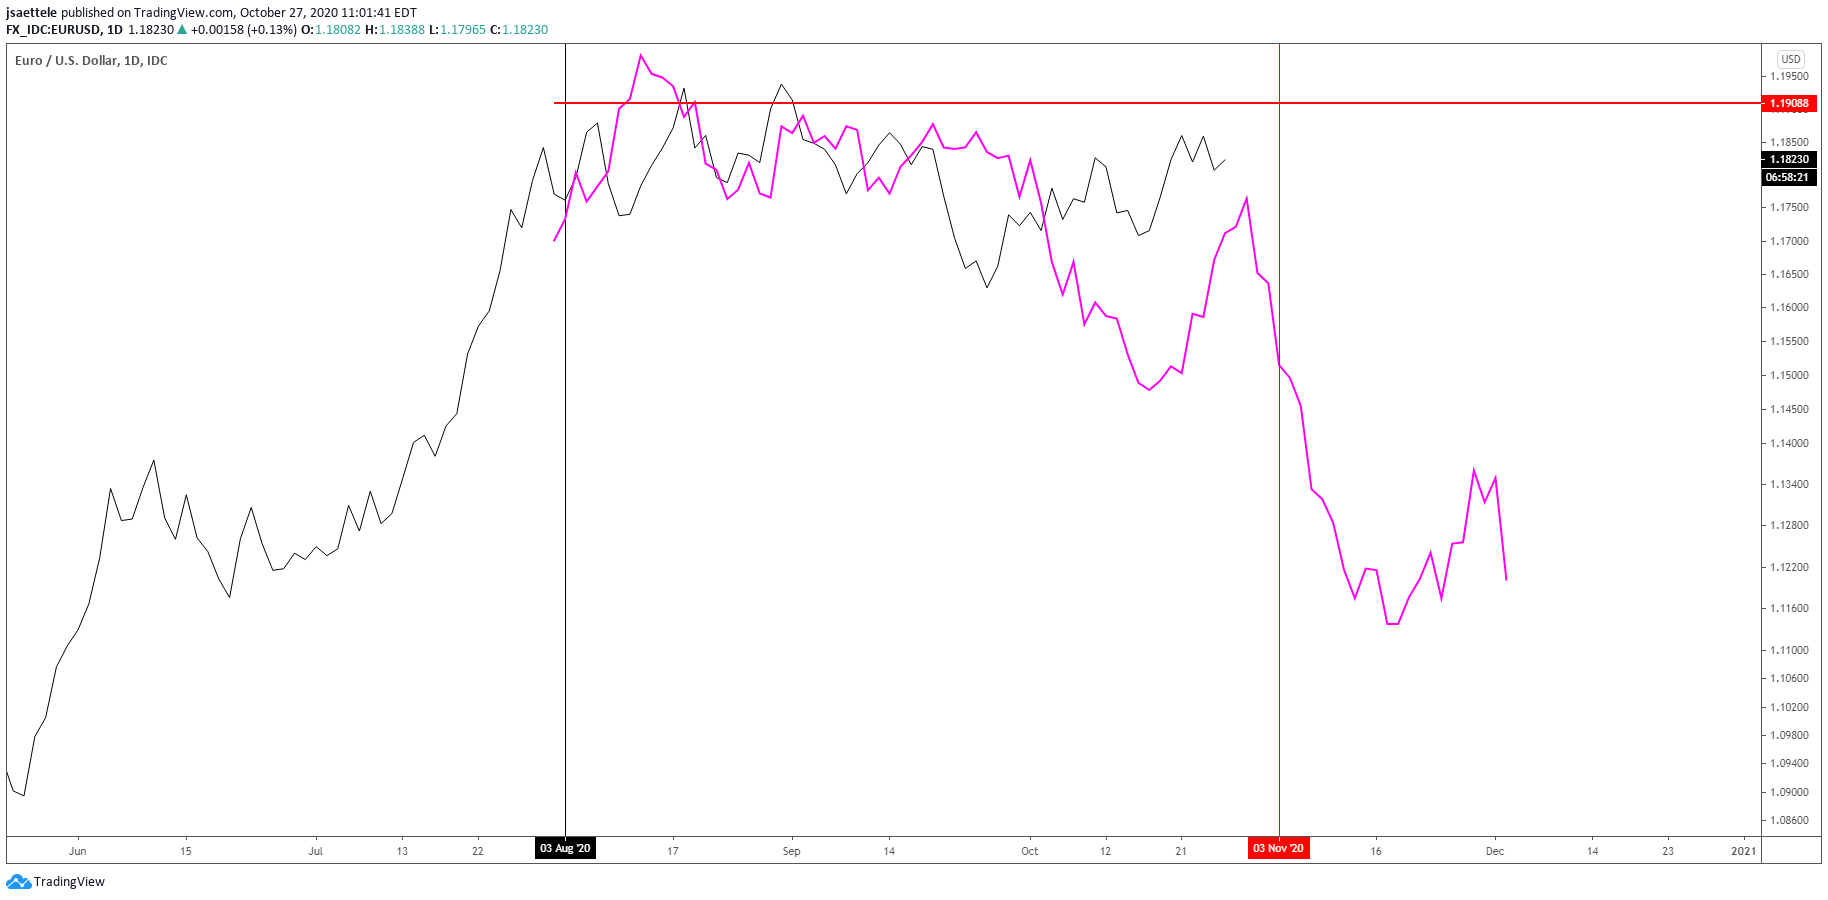
EURUSD NOW AND EURUSD 2016 CLOSES – 3 MONTHS BEFORE AND 1 MONTH AFTER ELECTION

A picture is worth a thousand words! Current EURUSD pattern is remarkably similar to 2016. Recall that in 2016, EURUSD spiked initially before plunging for the next month. The comparison with bars is shown below. If something similar were to happen, then EURUSD would spike to 1.1900 before reversing lower.
EURUSD NOW AND EURUSD 2016 BARS – 3 MONTHS BEFORE AND 1 MONTH AFTER ELECTION

USDJPY NOW AND USDJPY 2016 CLOSES – 3 MONTHS BEFORE AND 1 MONTH AFTER ELECTION

The USDJPY pattern over the last 3 months is also similar to the 3 months before the 2016 election. USDJPY turned up in the days before the election in 2016 only to spike nearly 400 pips lower, reverse again, and then go straight up for the next 5 weeks. A washout spike and eventual uptrend makes sense to me this time around too. Asset managers are the longest Yen in at least a decade while dealers are the shortest since 2012 (see COT report below and understand that futures are quoted JPY/USD). Extreme positioning is often present at major turns. Ironically, USDJPY is trading at the same level as it was before the 2016 election. Another ‘flush’ to rid the market of weak USDJPY longs before a massive reversal? Pay attention to 101ish (see weekly chart below), which has been massive since 1993 (you know the BoJ is sitting there).
JAPANESE YEN FUTURES COT

USDJPY WEEKLY

GOLD NOW AND GOLD 2016 CLOSES – 3 MONTHS BEFORE AND 1 MONTH AFTER ELECTION

Gold now and gold in 2016…almost identical. It’s as if ‘they’ forgot to change the election algorithm. Like EURUSD and JPY, gold saw a massive spike higher in 2016 before reversing and trending lower for a month. Be aware of 2000 for resistance in the event of a spike (see the bar chart below).
GOLD NOW AND GOLD 2016 BARS – 3 MONTHS BEFORE AND 1 MONTH AFTER ELECTION

AUDUSD NOW AND AUDUSD 2016 CLOSES – 3 MONTHS BEFORE AND 1 MONTH AFTER ELECTION

AUDUSD price pattern is similar to 2016 as well. In 2016, AUDUSD barely took out its August high on election day and then reversed lower. This year, the high was on 9/1. I’m of the mind that AUDUSD trades lower from current levels but did want to share the comparison.
CRUDE OIL NOW AND CRUDE OIL 2016 CLOSES – 3 MONTHS BEFORE AND 1 MONTH AFTER ELECTION

In 2016, crude took out its early September lows in the days just after the election before turning up sharply. Watch for something similar here. Proposed support is 34.25 (2 equal legs down from the September high). Interestingly, the low in crude following the 2016 election has been resistance since July (see 2 charts down).
CRUDE OIL DAILY

CRUDE OIL DAILY

DXY NOW AND DXY 1976 WEEKLY

Yes, the USD tends to get a bump after a U.S. Presidential election but recall that the USD put in a massive top 6 weeks after the 2016 election. The same thing happened when Nixon was elected in 1972. In the 4 years that followed, the USD dropped sharply and rebounded. Sound similar? In 1976, the USD held up for a month after Carter was elected before getting absolutely demolished over the next 2 years as inflation exploded. Now that’s a story I can buy. Regardless of who wins next week, it’s easy to imagine many throwing in the towel on the ‘inflation trade’ if the USD were to hold up for another month…just when it’ll be time to put that trade on in size!
DXY NOW AND DXY 1976 DAILY

1972

1976

1980

1984

1988

1992

1996

2000

2004

2008

2012

2016


