Market Update 2/7 – Huge Silver Reserval
SLV WEEKLY

SLV (silver ETF) made a massive volume reversal last week. It’s ‘massive’ because volume was 3 times the average of 13 week volume. The only other instances of this occurring are late 2010 and April 2011. The late 2010 instance was a false signal. The April 2011 instance was the all-time high. Near term, the drop in spot silver (see below) is in 5 waves so expectations are for a corrective advance before weakness resumes. The proposed resistance zone is 28.00/50.
SPOT SILVER HOURLY

DXY 4 HOUR

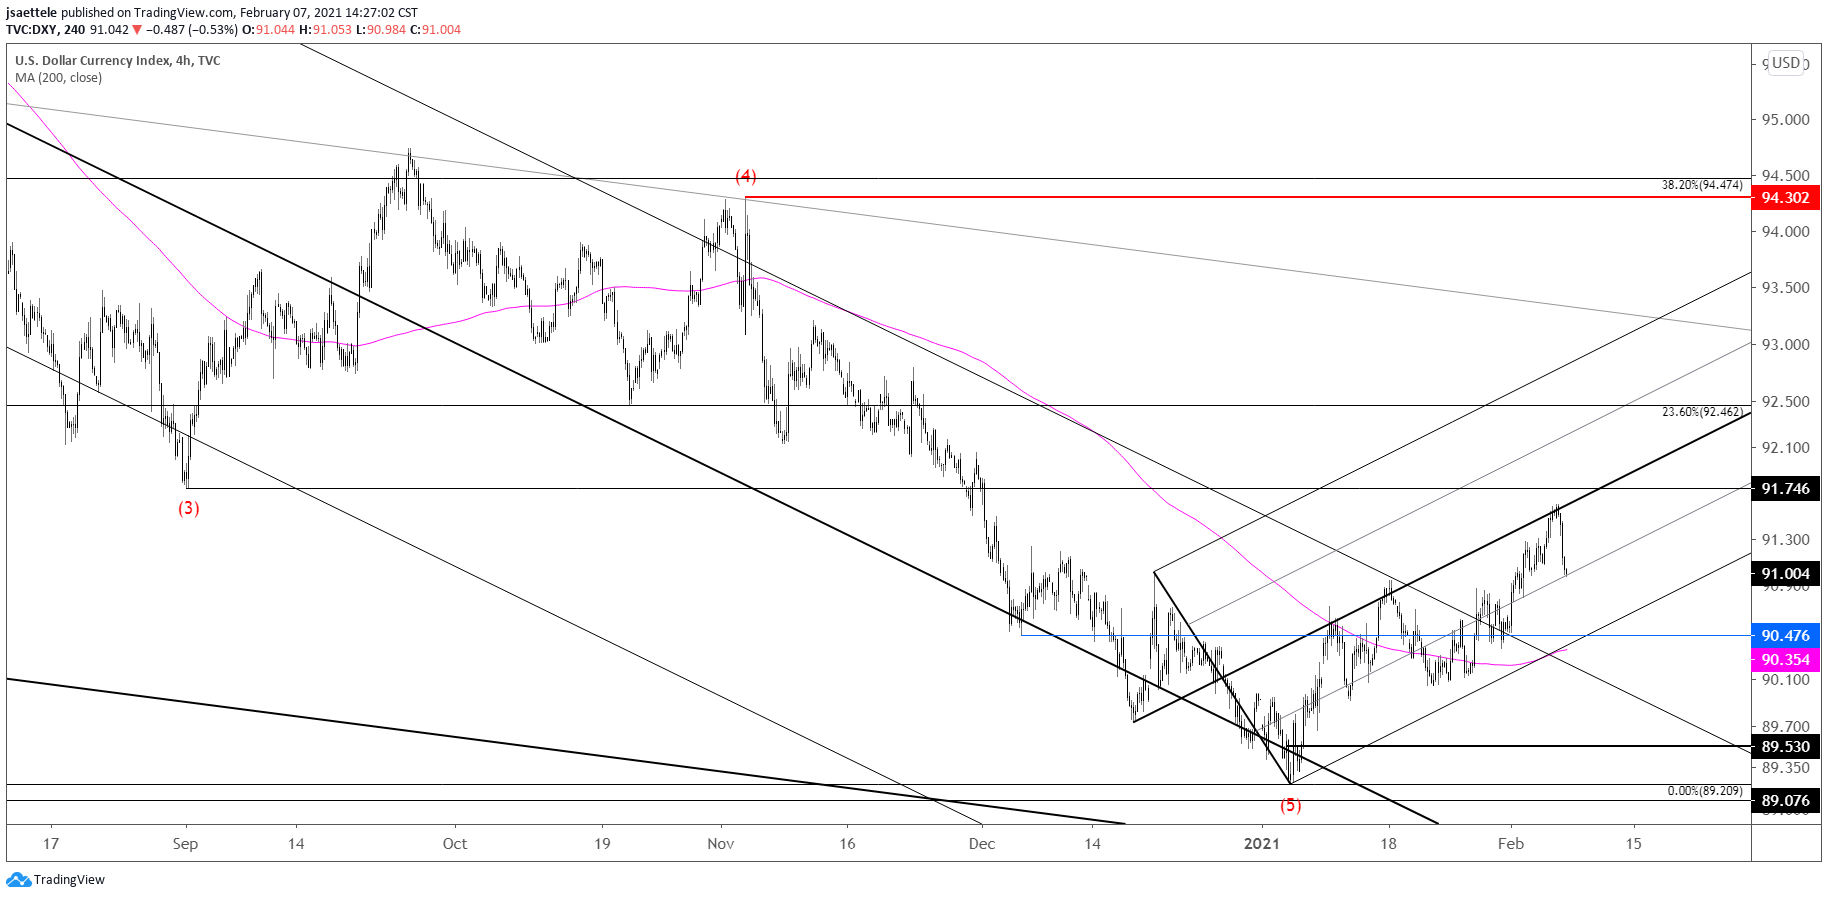
DXY tanked on Friday but price continues to trade within the short term bullish fork. Price ended Friday right at the 25 line so an early week bounce is possible. 91.30 is possible resistance now. Ultimately, proposed support is 90.50.
2/1 – DXY is trading right at the neckline from a head and shoulders bottom pattern. The objective from the pattern is 92.80 (magenta line) but the former low at 91.75 is a possible pausing level. Ultimately, I’m looking towards the underside of former channel support. This is near 95 and in line with the March low, former 4th wave high, and 38.2% retrace of the decline from the March high (see weekly chart below).
AUDUSD 4 HOUR

The 25 line was more important support than I was expected but the series of lower highs and lows remains. I’m thinking .7700ish for resistance. The level is defined by a spike high, VWAP from the high, and 2021 VWAP (see futures chart below).
2/2 – AUDUSD responded to the 25 line of the Schiff fork from the March low. Recall that price topped at the 75 line (75 and 25 lines are magenta)…a perfect example of median line symmetry! Focus remain towards the lower parallel near .7413. Proposed resistance is .7640.
AUSTRALIAN DOLLAR FUTURES HOURLY

NZDUSD 4 HOUR

NZDUSD ended last week at short term trendline resistance. Price needs to turn down now in order to maintain a near term bearish stance. If price does reverse up here, then I’ll entertain a short position. Still, .7120 remains the breakdown level.
2/4 – Kiwi action has been subdued the last few weeks but that could change soon. .7120 is huge. The level is defined by the confluence of the line off of the March and November lows and the center line of the channel from the high. A break below that level would likely lead to accelerated weakness. In the interim, .7180s is possible resistance.
USDJPY DAILY

USDJPY reversed from the well-defined 105.60s (former high and 200 day average). Price also turned down from short term channel resistance. The center line from that channel is in focus near 104.90. A short term chart is below.
2/4 – USDJPY is ticks away from 105.60s. Possible resistance for a pullback extends into 106.00ish, which is the 38.2% retrace of the decline from the March high. The level has served as an important pivot since last May and is also defined by a median line from a multi month bullish fork (see 4 hour chart below). If a pullback occurs before 106.00 then proposed support is 105.17.
USDJPY 4 HOUR


