Market Update 2/9 – Watch this Bitcoin Level!
BITCOIN DAILY

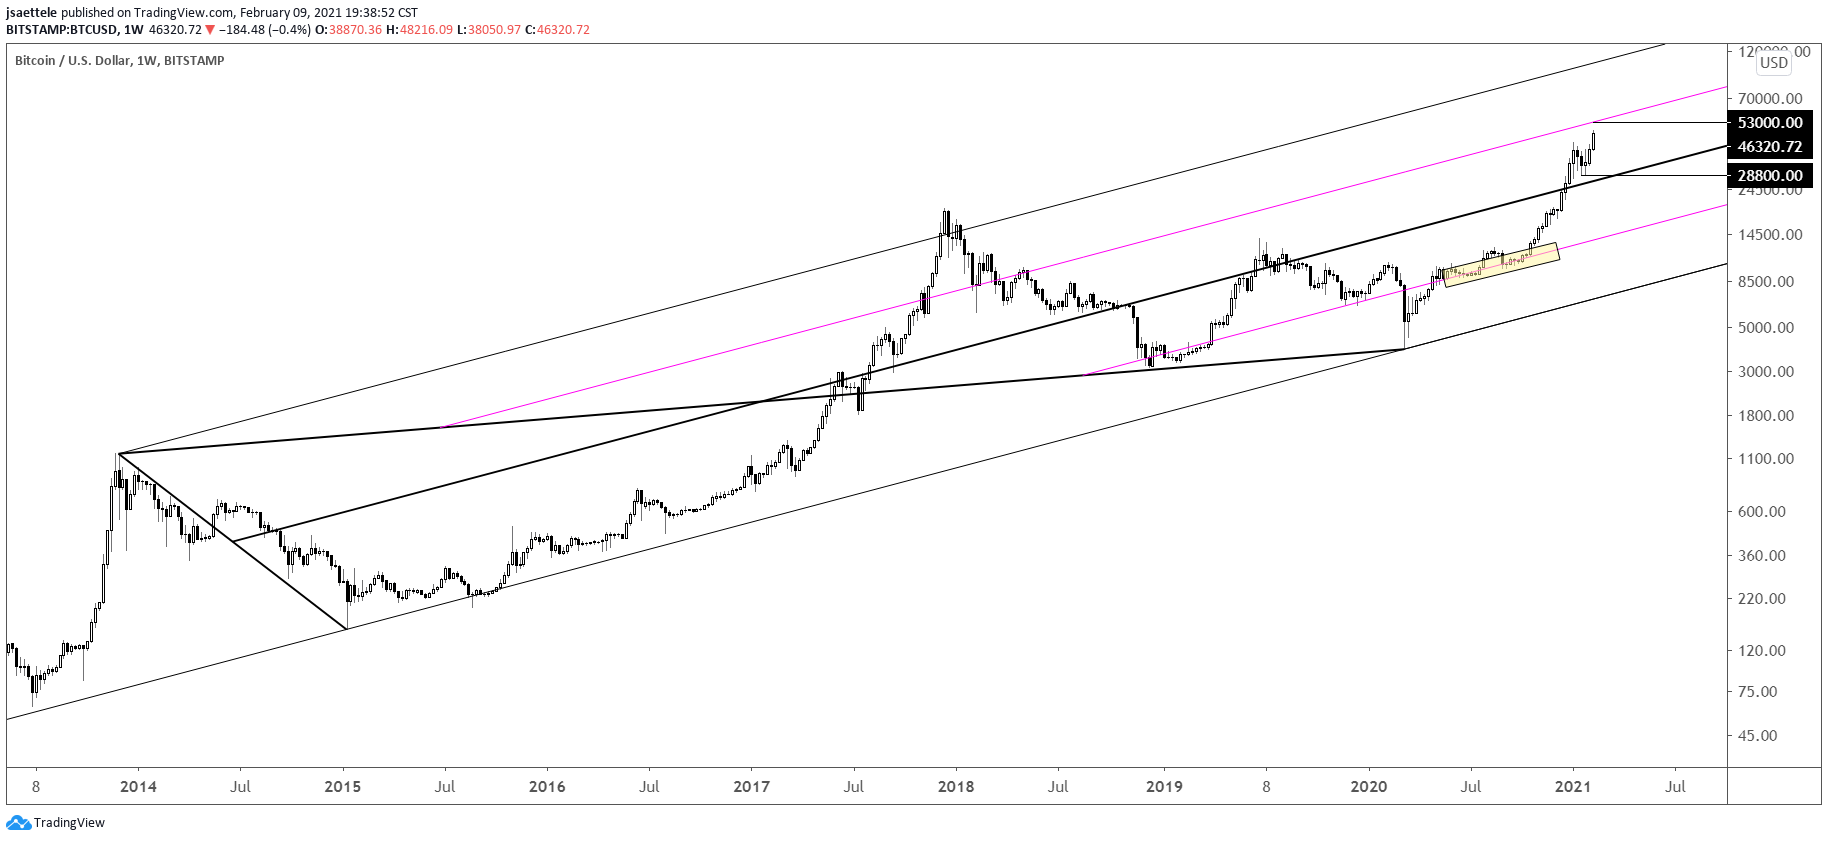
If I look at Bitcoin as nothing more than a liquid asset and apply a channel to price history then 53k (give or take) is a level to pay attention to. The level is defined by the 75 line of the channel from the January 2015 low. As an aside, the Bitcoin bottom then was 1/15/2014…one day before the SNB let the floor go on EURCHF. I bought BTCUSD that day but then sold in May 2017. Worst exit ever? The fact that I think about that now is instructive from a timing standpoint. Anyway, the 25 line was support (highlighted) from May to October last year. As per median line symmetry, the 75 line is expected resistance…which is 53,000.
DXY 4 HOUR

DXY has reached the lower parallel from the short term bullish fork. The level is also defined by VWAP from the low and 2021 VWAP (see below). Price needs to turn up now in order to remain constructive the USD.
2/7 – DXY tanked on Friday but price continues to trade within the short term bullish fork. Price ended Friday right at the 25 line so an early week bounce is possible. 91.30 is possible resistance now. Ultimately, proposed support is 90.50.
U.S. DOLLAR INDEX FUTURES HOURLY

EURUSD 4 HOUR

Proposed EURUSD resistance is 1.2150s, which is the 200 period average on the 4 hour chart and an important pivot since late December (initially support and then resistance). VWAP from the high and 2021 VWAP are also in the vicinity (see below). I’m focused on 1.2150s to re-short.
2/8 – EURUSD has bounced to test the underside of the neckline from the head and shoulders top that was confirmed last week. Possible resistance extends up to 1.2100 and 1.2004 (high volume level from NFP) is now possible support.
EURO FUTURES HOURLY

GBPUSD DAILY

Cable is closing in on 1.4000, which is not only important from a psychological perspective but is also the line off of the 2007 and 2014 highs. If price pulls back before reaching 1.4000, then watch for support near 1.3720. 1.3720 is the top side of the line that connects highs since March 2019 (previously resistance so watch for the line to provide support).
GBPUSD 4 HOUR

AUDUSD 4 HOUR

AUDUSD is trading at the noted .7740. Again this is the underside of the line from the March low. Think in zones at this juncture and allow for .7760 before giving up on downside. .7760 is the line that crosses highs since the 1/6 top and the 1/27 high. Bottom line, a turn lower from .7740/60 wouldn’t be a surprise.
2/8 – AUDUSD is testing the noted .7700 level (VWAPs…see yesterday’s futures chart). Proposed resistance is now and .7740, which is the underside of the line off of the March and November lows (red line).
AUDUSD WEEKLY

USDCAD 4 HOUR

If USDCAD action since mid-December is a bullish base then support should register near 1.2670, which is the lower parallel from the bullish fork that originates at the 12/15 low. The median line of this structure provided resistance, which is why the lower parallel is of interest as support. In other words, it’s not arbitrary.


