Market Update: March 15
EURUSD 4 HOUR
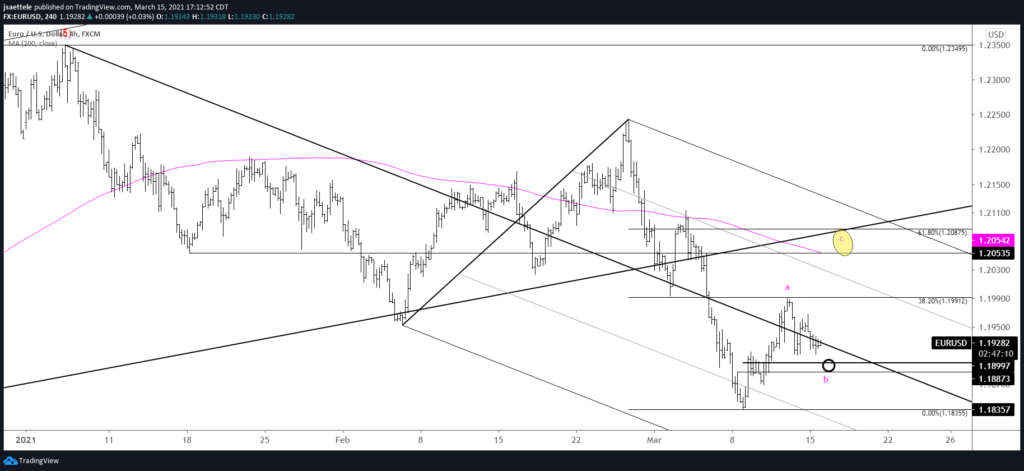
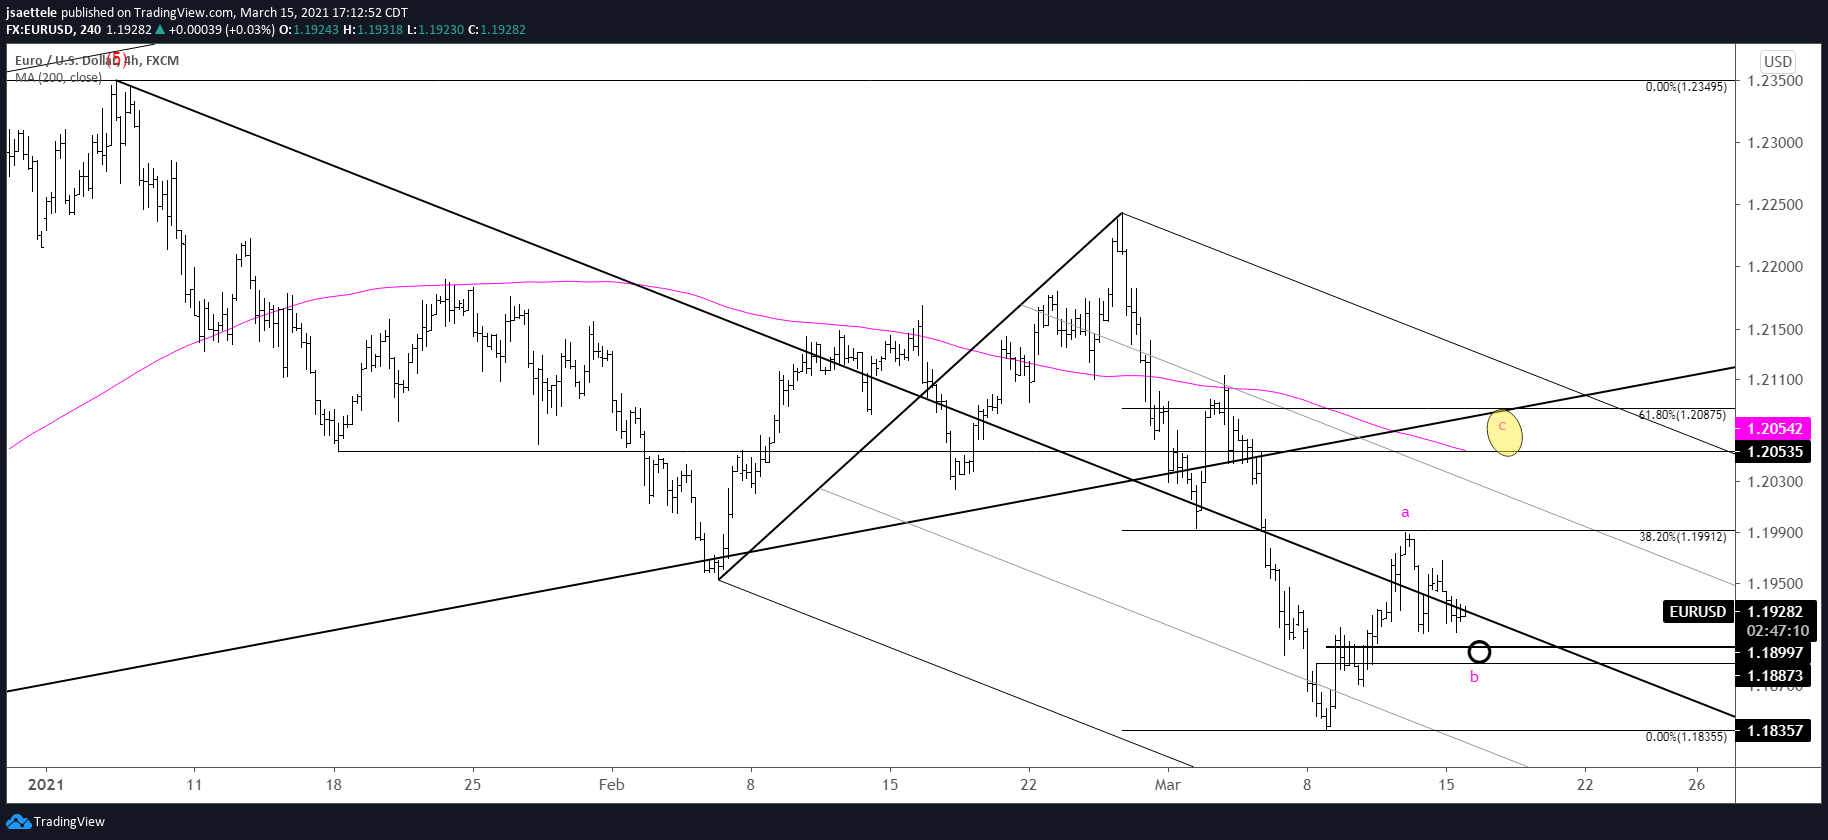
EURUSD may be working on a 3 wave rally from the 3/9 low. Proposed support for wave B is just under 1.1900…1.1887/99 is daily reversal support, the 61.8% retrace of the rally from the low, and 2 equal legs down from the 3/11 high. If this interpretation is correct, then price will rally into 1.2050/90 (month open is 1.2070 as well).
3/11 – The 4th wave idea described yesterday looked promising for a few hours…then EURUSD blasted through 1.1950. Current pattern is unclear from my vantage point but the next upside level of interest looks like 1.2050/75. This is the 25 line of the bearish fork from the January high and the underside of the center line from the channel that originates at the March 2020 low. 1.1950 is now proposed support.
GBPUSD 4 HOUR
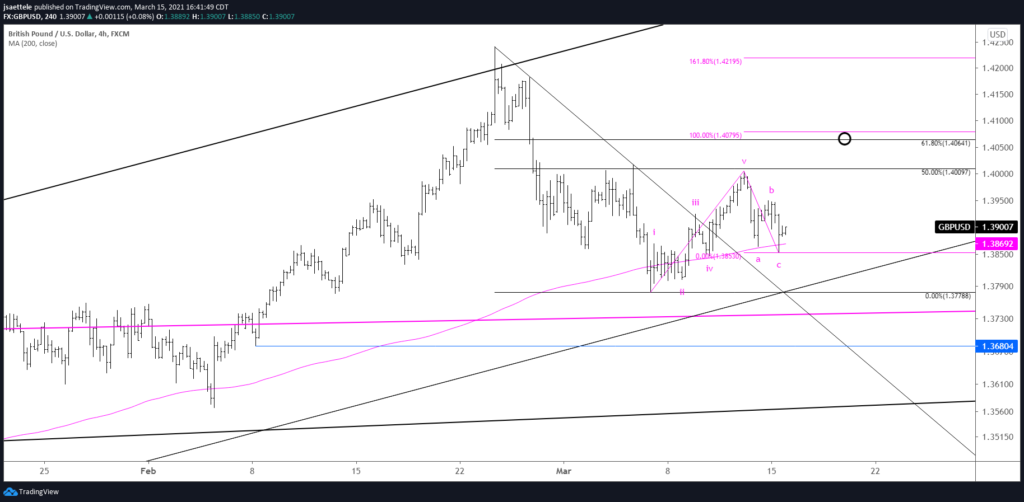
GBPUSD may have completed a 3 wave drop today. The hour of the low was on high volume, which indicates possible capitulation. I’m looking higher into 1.4064/80 (61.8% retrace and 2 equal legs up).
3/11 – I maintain that the GBPUSD rally from last week’s low is an impulse (5 waves) that is near completion. 1.4010 is a well-defined level for resistance. The implication is that price rolls over and declines in 3 waves.
USDJPY 4 HOUR

The USDJPY rally from the January low ‘counts’ in 5 waves with an extended 5th wave. Recall that price is also testing the trendline that originates at the 2015 high. Price could try and test 109.55, which is where wave 5 would equal 161.8% of waves 1 through 3. That’s also the upper parallel of the bullish fork that originates at the November low. If price turns down before then, then I’ll consider a short entry against the high.
3/7 – USDJPY is trading just above the July 2020 high and 61.8% retrace of the decline from the March 2020 high. A huge test looms near 109.20, which is the confluence of trendline resistance from the 2015 high and the bullish fork that originates at the November low. The median line from that fork is now possible support near 106.80. A close up view is below.
USDCAD DAILY
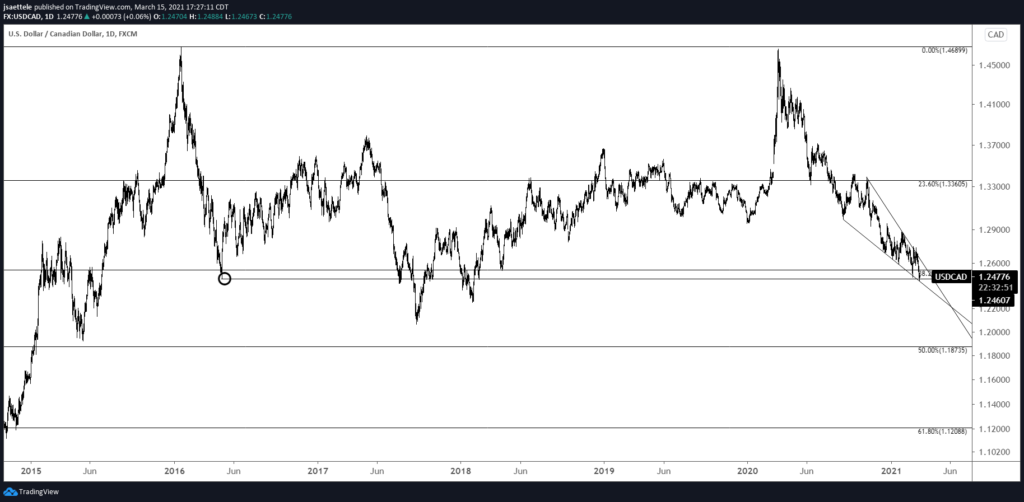
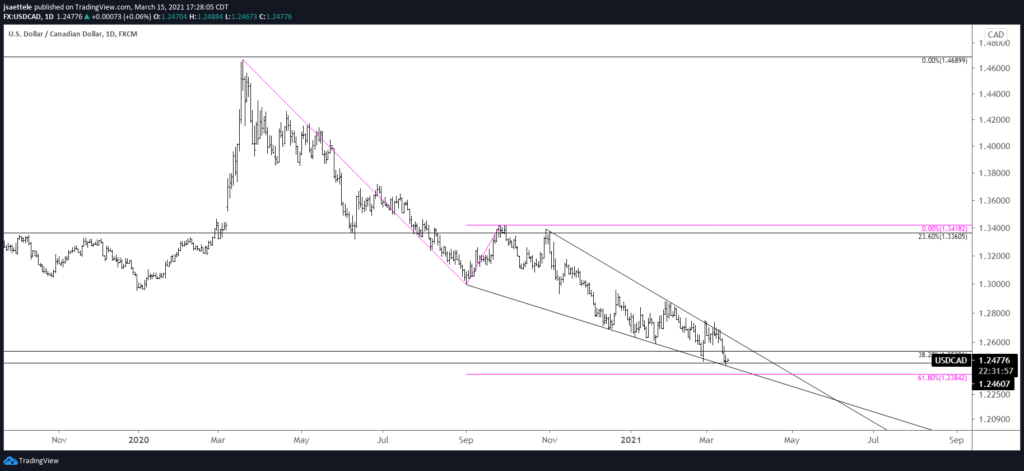
USDCAD is testing the 2016 low (1.2460) along with the lower wedge barrier (line that connects lows since September). This is a good spot for USDCAD to attempt a turn higher but there is no evidence that warrants a long entry at this point. If evidence arises, then I’ll discuss it in these pages. A shorter term view is below.
USDCAD 4 HOUR
USDTRY 4 HOUR
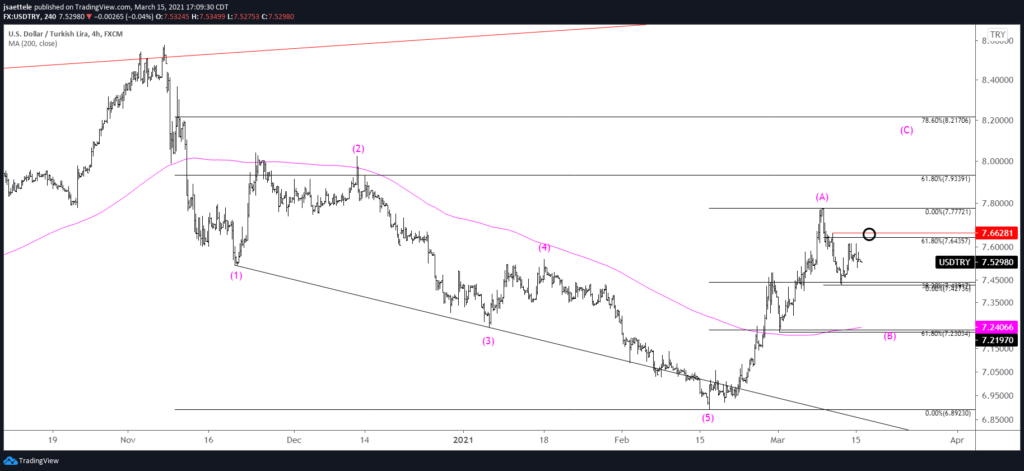
No change to USDTRY pattern or trading implications other than noting that 7.6435-7.6628 is proposed resistance for a lower high against the 3/9 high of 7.7772.
3/9 – USDTRY ripped through what I thought would prove resistance but reversed sharply lower today. The proposed pattern (A-B-C from the low) remains favored. The B wave could bring the rate back to 7.23 or so (former 4th wave low and 61.8% retrace). Proposed resistance is 7.7050-7.7100.

