Market Update: March 11
Market Update 3/10 – EURUSD Idea into ECB
March 11, 2021Market Update: March 15
March 16, 2021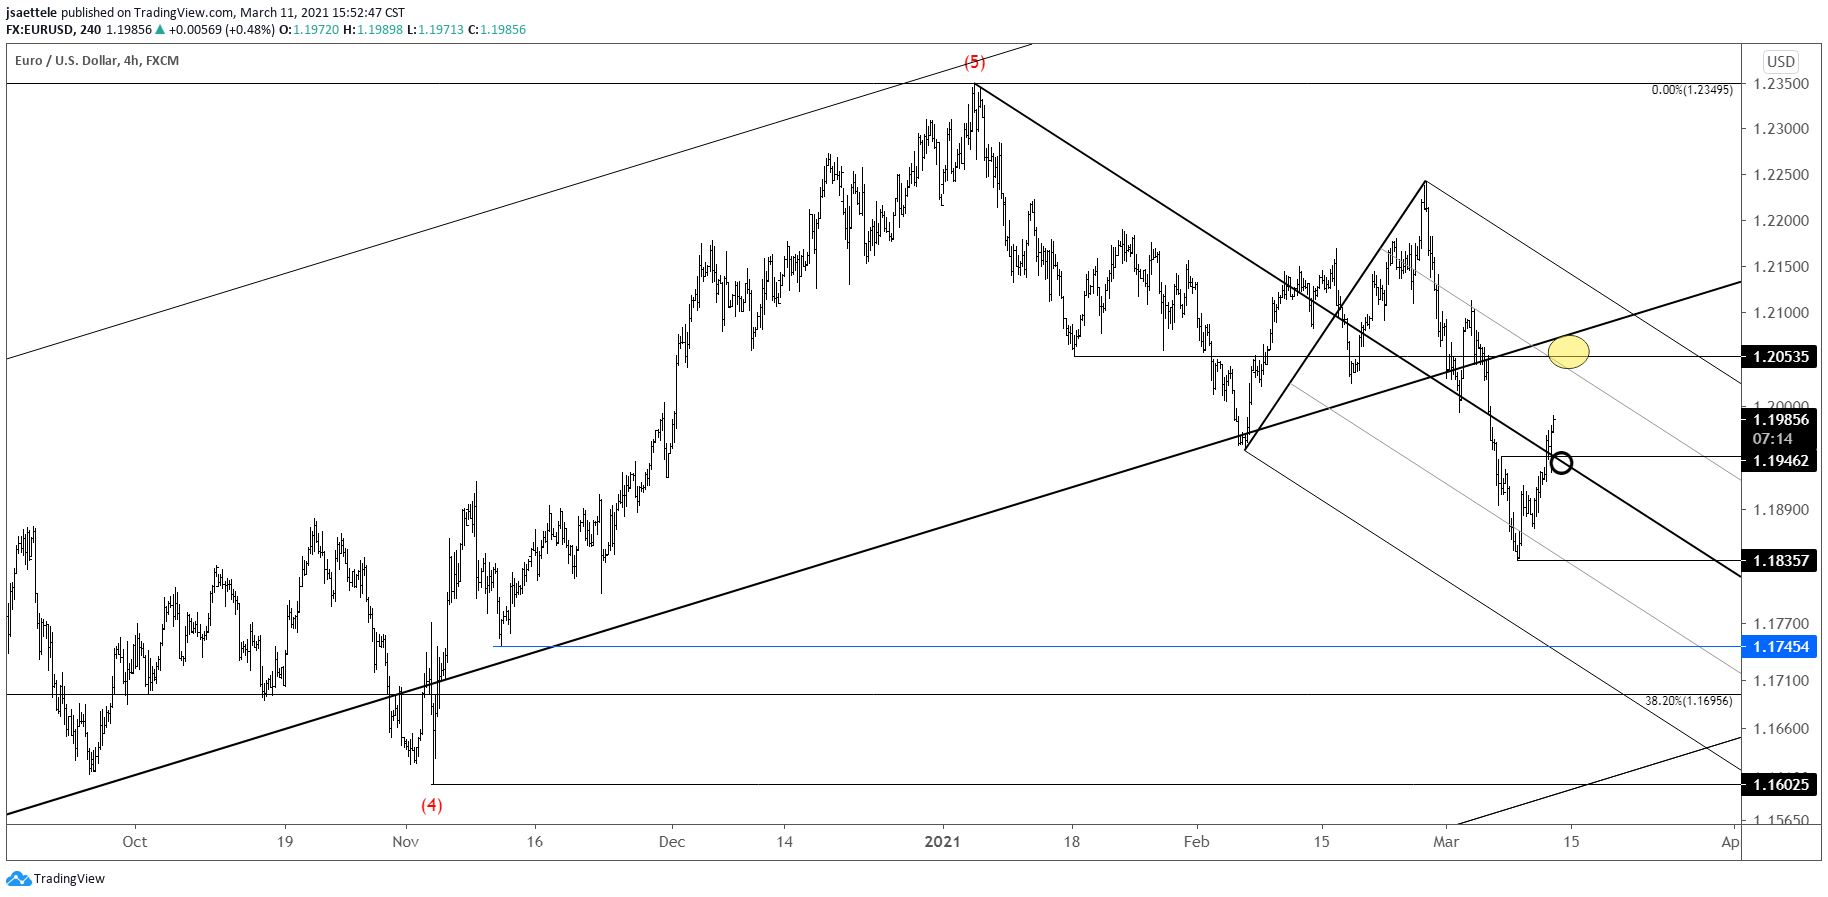
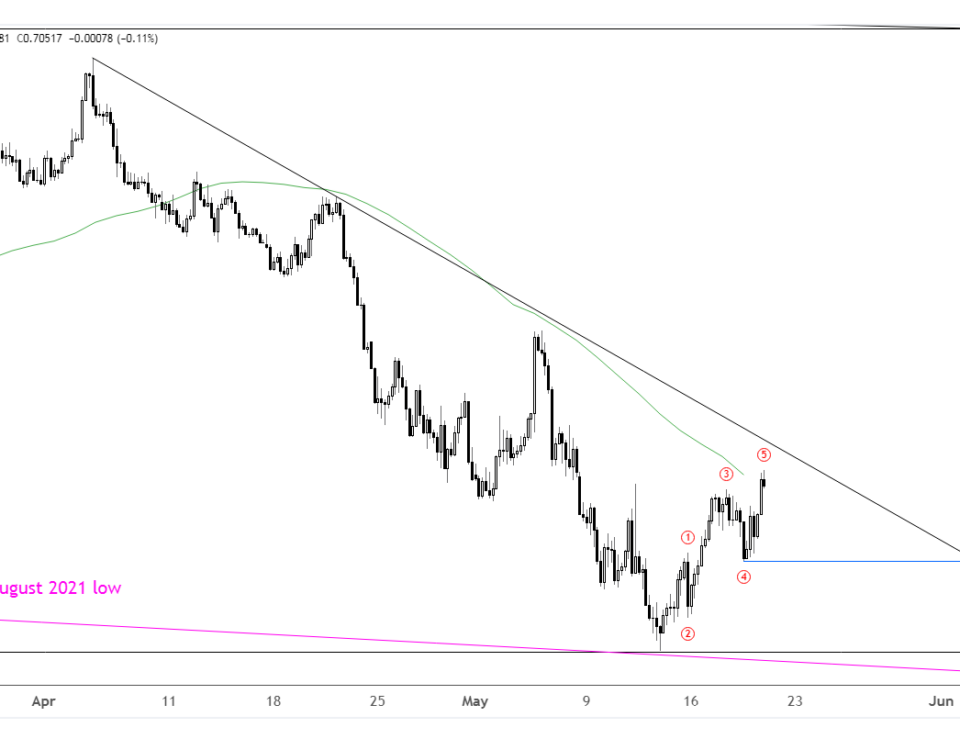
EURUSD 4 HOUR
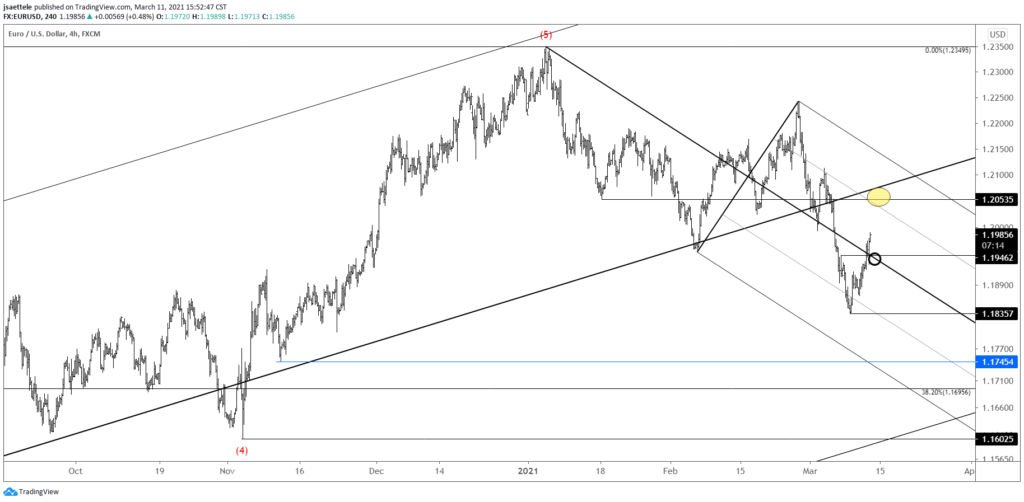
The 4th wave idea described yesterday looked promising for a few hours…then EURUSD blasted through 1.1950. Current pattern is unclear from my vantage point but the next upside level of interest looks like 1.2050/75. This is the 25 line of the bearish fork from the January high and the underside of the center line from the channel that originates at the March 2020 low. 1.1950 is now proposed support.
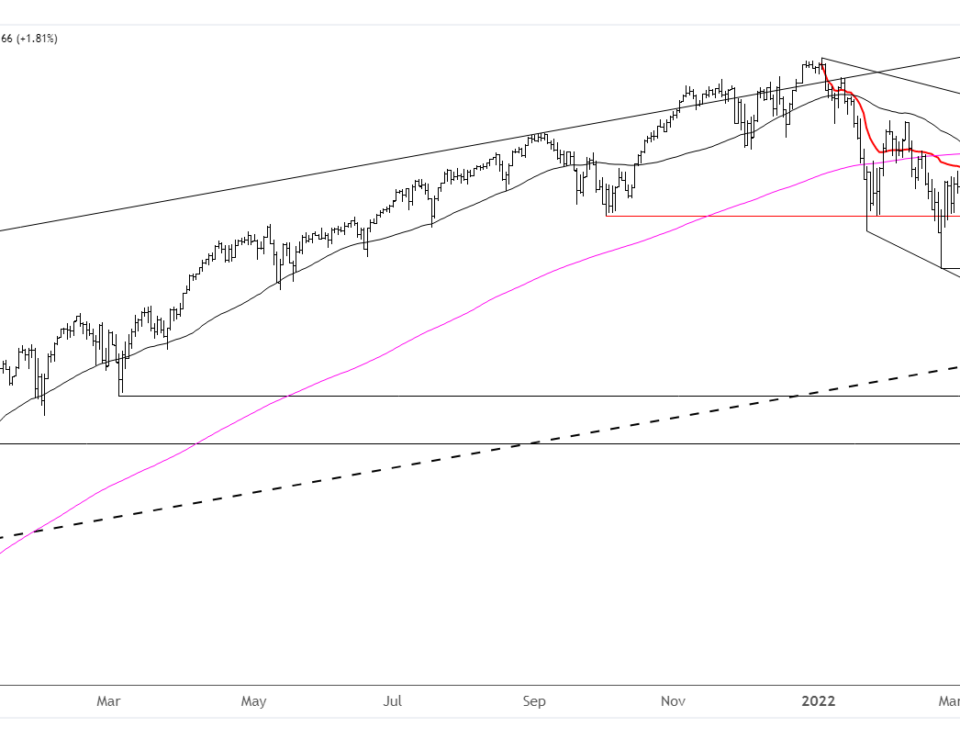
GBPUSD HOURLY
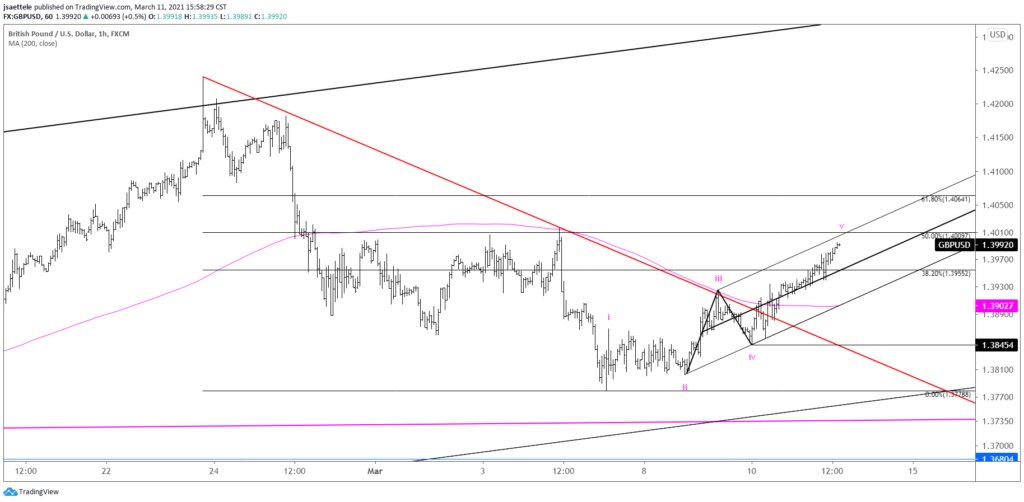
I maintain that the GBPUSD rally from last week’s low is an impulse (5 waves) that is near completion. 1.4010 is a well-defined level for resistance. The implication is that price rolls over and declines in 3 waves.
3/10 – R.N. Elliott counted waves with hourly close data (line chart). Viewed in this manner, the GBPUSD rally from last week’s low is nearing the end of 5 waves up. It’s perfect. Notice how subwaves 1 and 3 each subdivide into 5 waves. Subwave 5 appears to have a bit more upside. Watch for resistance near 1.3950. The swing setup is buy the bigger pullback, probably near 1.3850 (former 4th wave low). It’s important to note than GBPUSD held 2021 VWAP last week (see futures chart below).
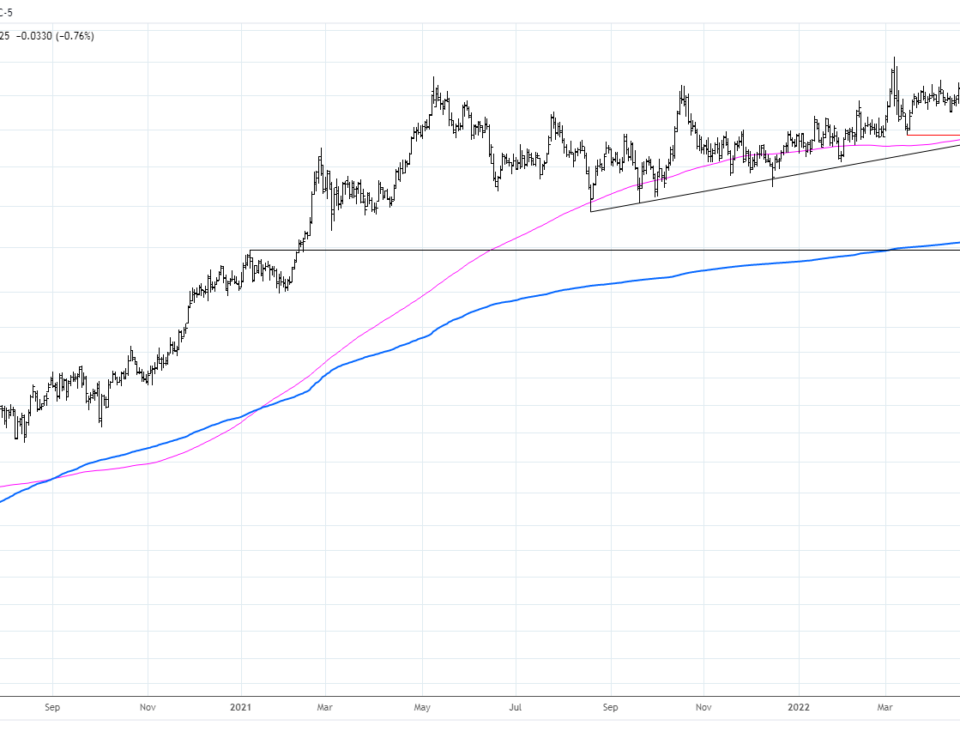
USDCNH DAILY
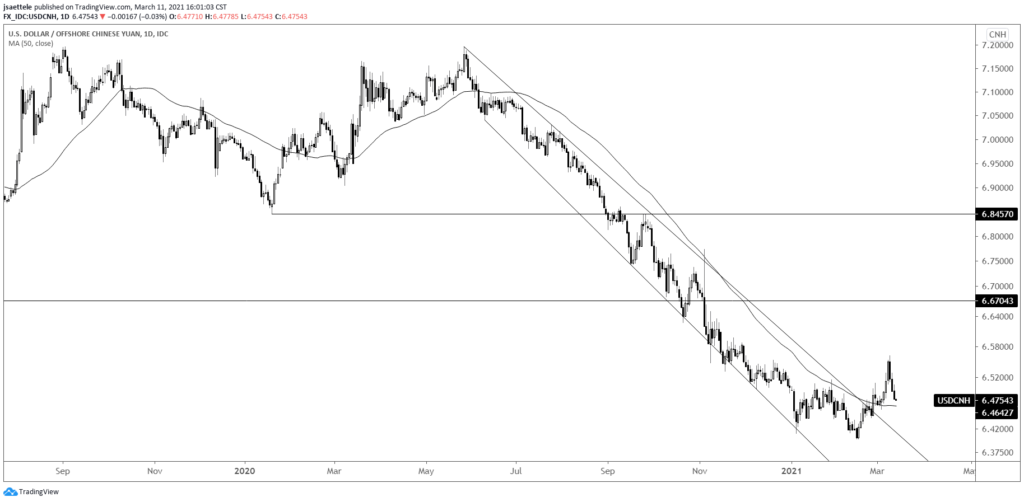
USDCNH has responded to the 50 day average for well over a year. That average is currently 6.4640 and should be watched for support.
2/25 – This is an extremely important chart. The behavior change in USDCNH is significant. As noted last week, important turns have occurred with non-confirmations between USDCNH and DXY. My view then is that DXY is headed higher (until noted otherwise) due to the USDCNH break above trendline resistance.
USDMXN DAILY
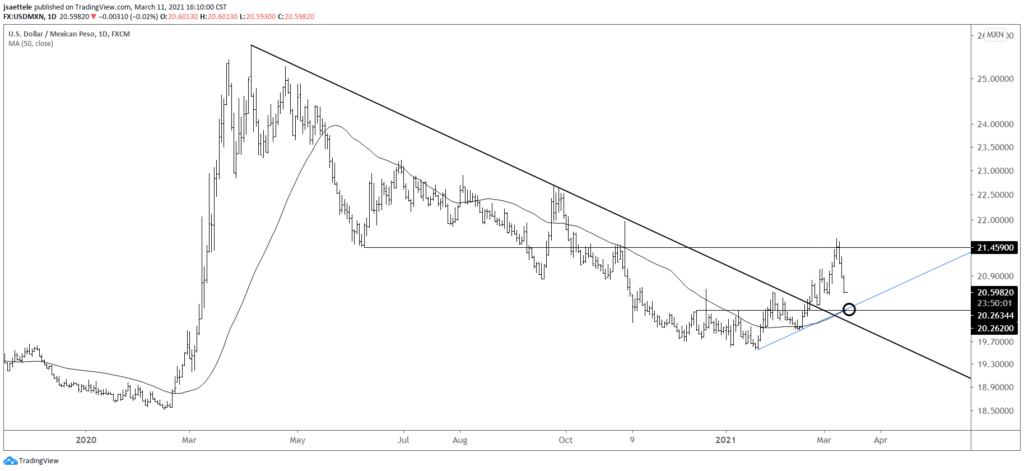
USDMXN traded into the noted June low at 21.46 and has tanked since. The trendline from the low and 50 day average are in line with the well-defined 20.26 level. Watch that level for support.
2/21 – USDMXN sports a possible head and shoulders bottom pattern since early December and is testing the trendline that originates at the March high. This is interesting since the USD has been tanking nearly everywhere else. A break above 20.67 would complete the pattern and shift focus to former support from the June low at 21.46.