Market Update 2/10 – USD Support?
S&P TOP 50 INDEX COLLARS AT RECORD LOW
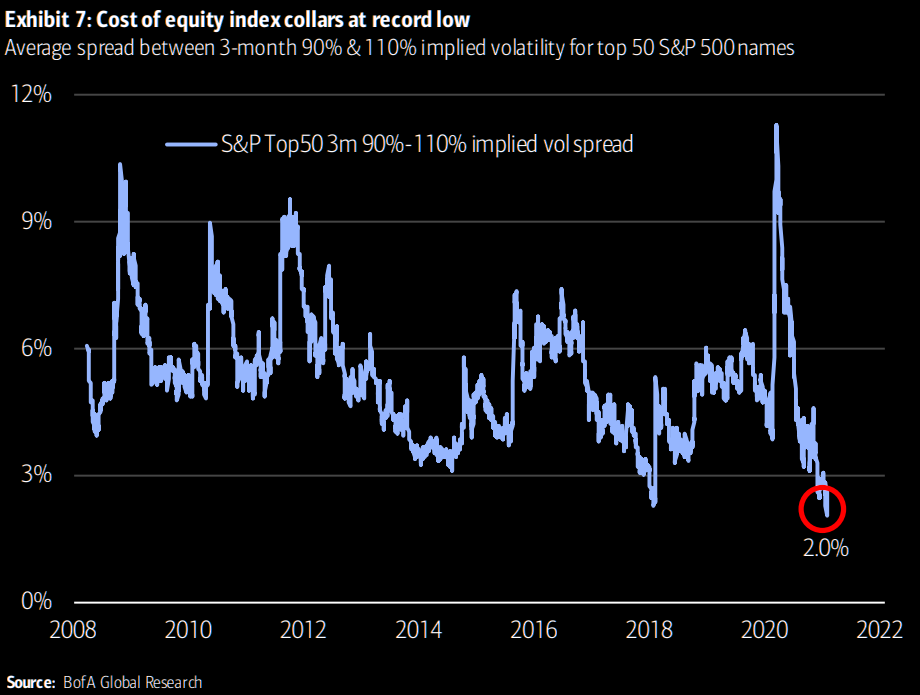
First, some ‘techamental’ charts that illustrate the extreme situation present in U.S. equity markets.
The above chart shows that calls are more expensive to puts by a record margin.
SPAC INSANITY
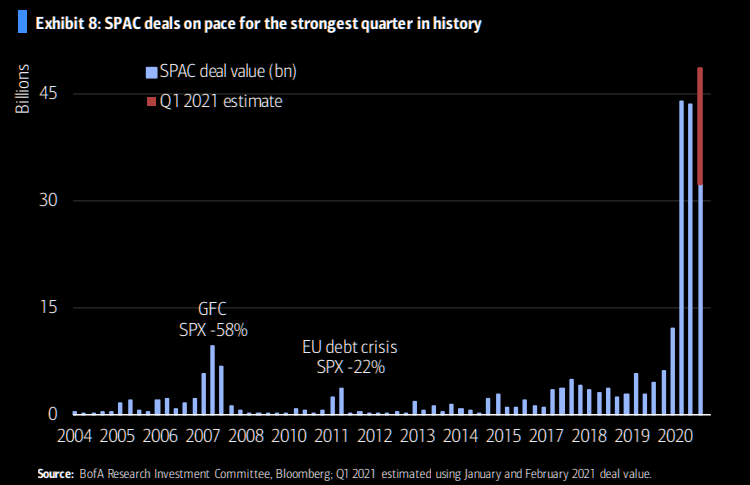
SPACs, also known as ‘blank check’ companies, allow retail investors to invest in private equity type transactions. According to the SEC, “a SPAC is created specifically to pool funds in order to finance a merger or acquisition opportunity within a set timeframe. The opportunity usually has yet to be identified.”
Bank of America notes that “one study found that the hidden fees and costs are so large that for every $10 raised in a SPAC IPO, less than $7 in cash remains by the time the average SPAC acquires a target”.
FYI, previous peaks in SPACs were in 2007 and 2011. SPX fell by almost 60% and 22% following those peaks.
EVERYONE IS A DAY TRADER (FROM GOLDMAN)
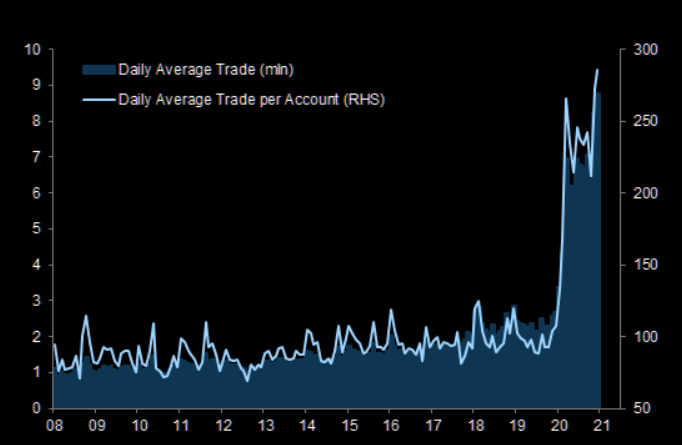
Retail gets involved at the top. It seems that they are involved (or obsessed).
S&P 500 FUTURES (ES) DAILY
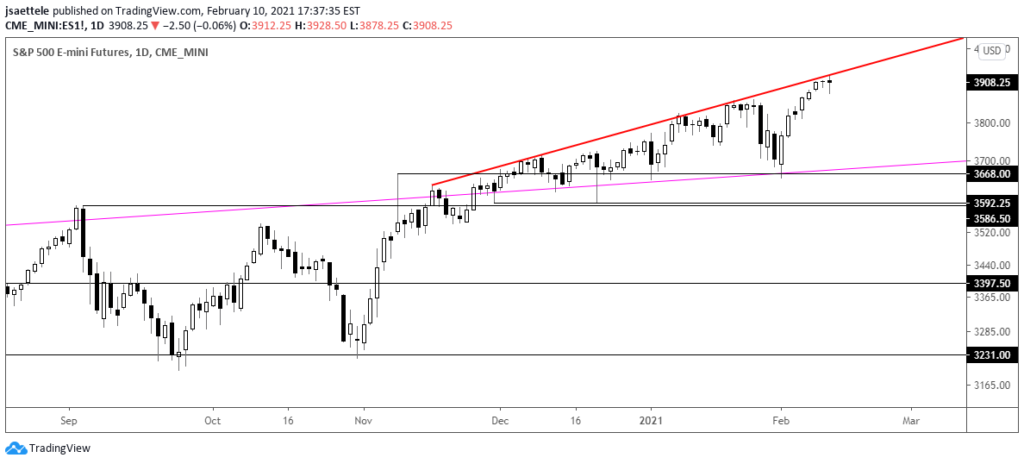
ES hit the line that crosses highs since November and made a large outside day today (engulfed the prior 2 days). The day ended with a doji (not perfect but close enough). The trendline and candlestick combination suggest that this could be a top of sorts.
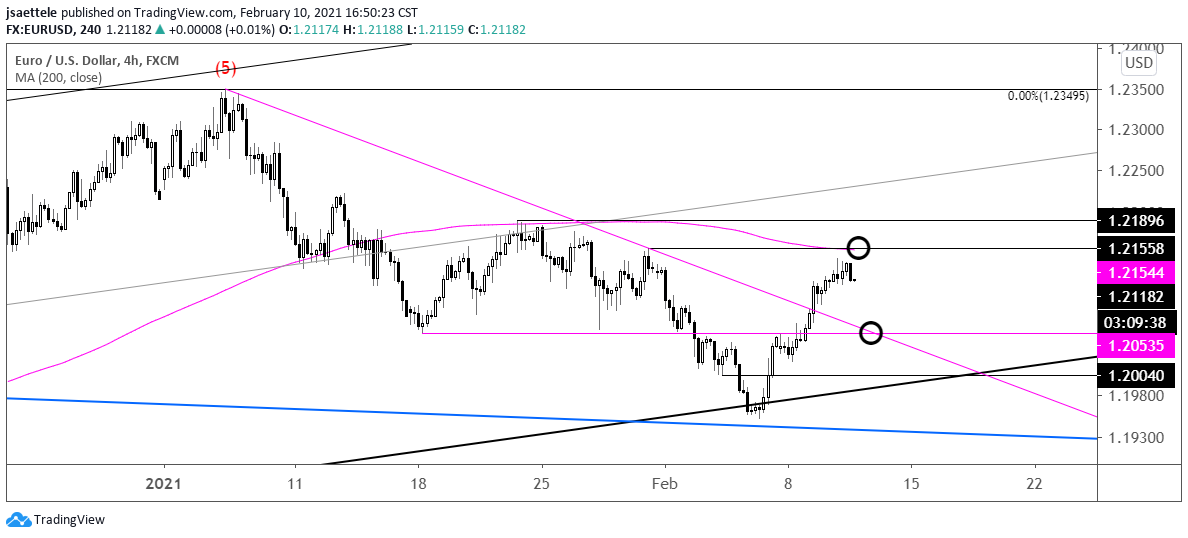
EURUSD 4 HOUR
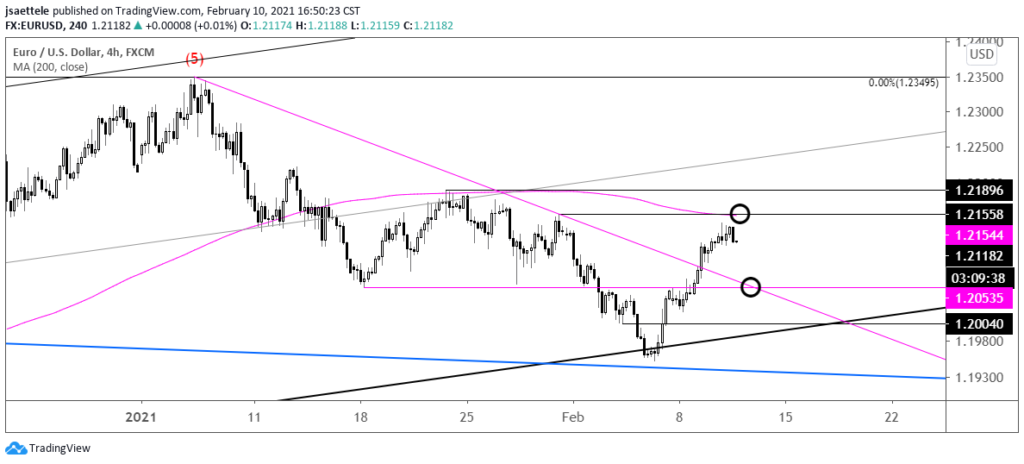
EURUSD traded in a very narrow range today and also made a doji (perfect doji…open and close are the same). Price tagged the month open too (1.2133). The 1/29 high and 50 day average are both 1.2155. Maybe we get a spike into that level before lower? I like leaving a short order at that level. 1.2050s may be support now.
2/9 – Proposed EURUSD resistance is 1.2150s, which is the 200 period average on the 4 hour chart and an important pivot since late December (initially support and then resistance). VWAP from the high and 2021 VWAP are also in the vicinity (see below). I’m focused on 1.2150s to re-short.
AUDUSD 4 HOUR
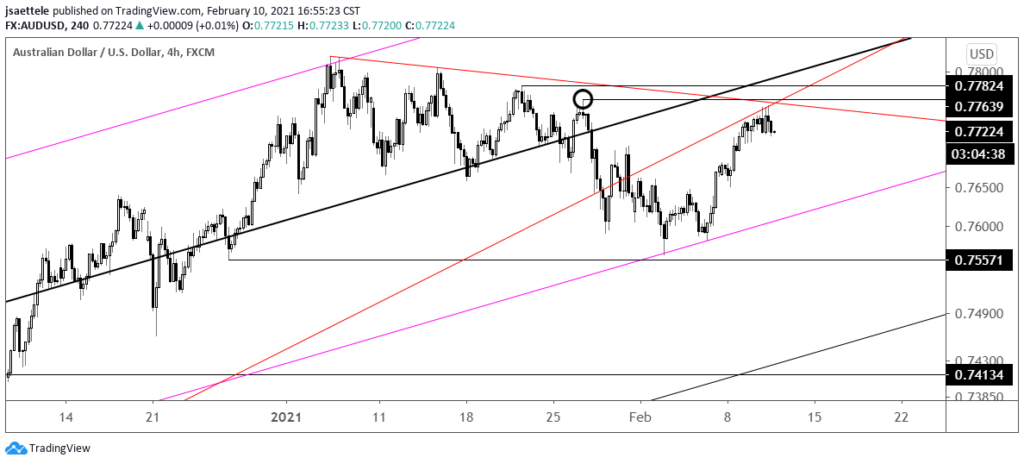
AUDUSD oscillated around the noted resistance zone all day before finishing with a small range key reversal. Another stab at .7760 isn’t out of the question in order to test the line that connects the highs since early January. I’m liking a short into that level.
2/9 – AUDUSD is trading at the noted .7740. Again this is the underside of the line from the March low. Think in zones at this juncture and allow for .7760 before giving up on downside. .7760 is the line that crosses highs since the 1/6 top and the 1/27 high. Bottom line, a turn lower from .7740/60 wouldn’t be a surprise.
USDCAD 4 HOUR
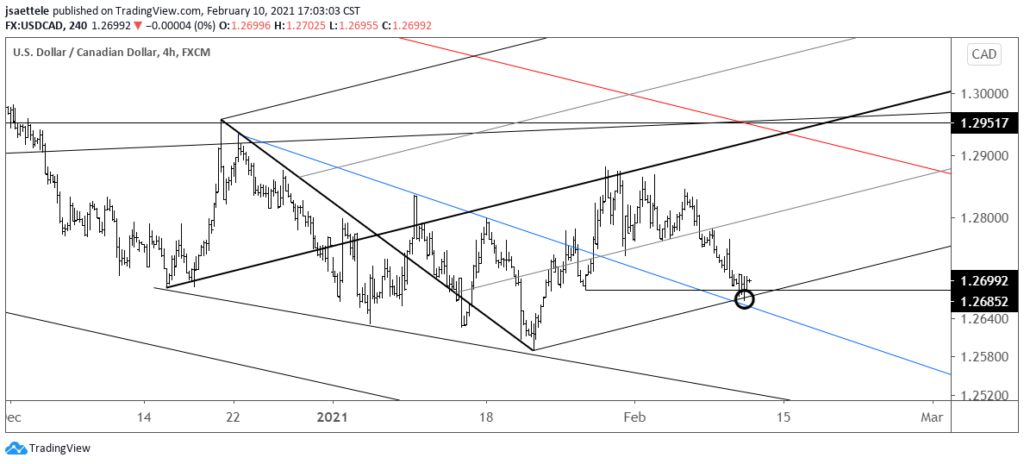
USDCAD eased into noted support like an old man slipping into a hot bath. A 4 hour volume reversal also triggered today. As such, it’s worth a short on the long side now with a tight stop. Initial upside focus is the month open at 1.2789.
2/9 – If USDCAD action since mid-December is a bullish base then support should register near 1.2670, which is the lower parallel from the bullish fork that originates at the 12/15 low. The median line of this structure provided resistance, which is why the lower parallel is of interest as support. In other words, it’s not arbitrary.
NZDJPY DAILY
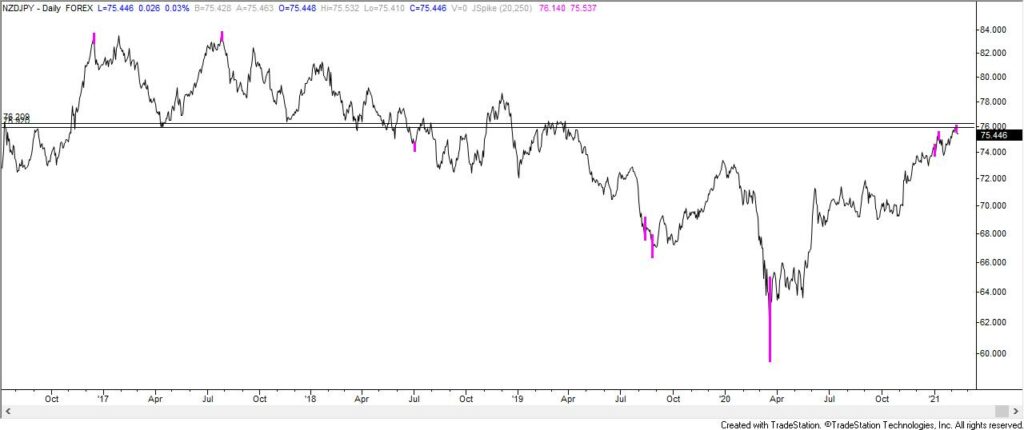
NZDJPY made a J-Spike (key reversal with a volatility condition) on Tuesday. J-Spikes at 1 year highs (250 day highs to be exact) are shown in magenta on the chart. The signal combined with the well-defined horizontal level warrants a short position against the high.

