
Market Update 10/6 – USDNOK Trade Idea
SPOT SILVER 4 HOUR
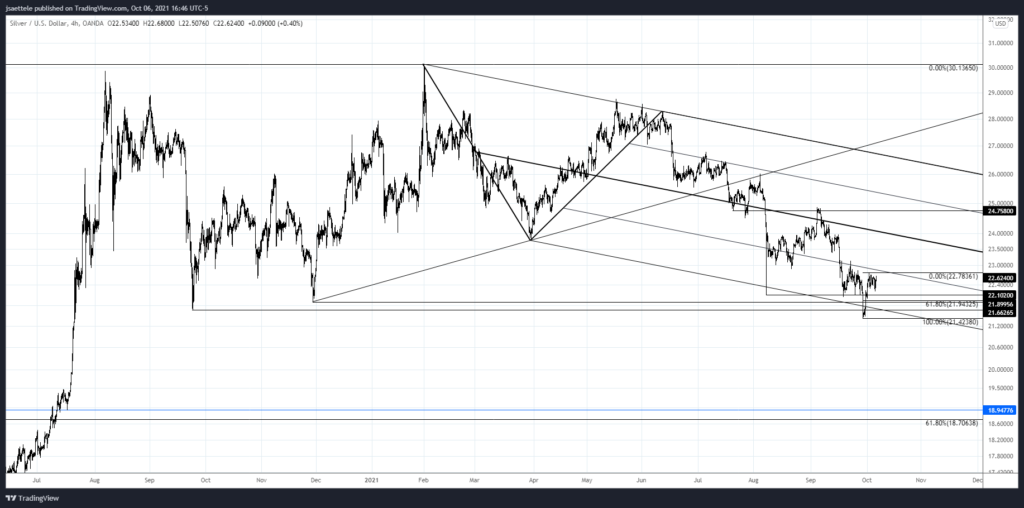
Silver is bullish. The rally from the low is impulsive. The question is whether or not the correction is complete. Either price pulls back to 21.90-22.10 or price breaks above the 75 line (parallel just above price) and the top side of that line then provides support. A zoomed in version and possible path is below.
9/30 – Silver turned up sharply today after dipping below the September 2020 low. Support is reinforced by channel support down here as well. Simply, the combination of well-defined support and extreme pessimism (numerous headlines include ‘plunge’) suggest that it’s time to turn bullish. I like the long side now. The first test is about 22.88.
SPOT SILVER 4 HOUR

EURUSD WEEKLY

Heads up on 1.1470-1.1500 in EURUSD. This is the top side of the trendline from 2008 and March 2020 high. I’m seeing some ‘extreme language for the first time in a while regarding euro weakness (tumble for example in a headline) which suggests that sentiment is ripe for at least a snap-back rally. Again…all eyes on 1.1470-1.1500.
10/5 – EURUSD has been trading around the key 1.1600 for the last week. Unlike other GBP, AUD, and NZD however, near term action is not constructive. That is not to say that price can’t resume higher following Friday’s small range reversal but a clean near term bullish setup is not (not yet at least) in play.
EURUSD DAILY

GBPUSD HOURLY

My view is that Cable is pulling back in 3 waves and that today’s bounce is wave B of the A-B-C decline. Proposed resistance is 1.3600/10. Ultimately, support for the end of the correction is 1.3500/20.
10/5 – I continue to lean towards the idea that the next GBPUSD dip is a buying opportunity. Of course, we need the dip! There is a lot in the way for possible resistance up to about 1.3670. The underside of the line off of the July and August lows is now (along with short term VWAP resistance…see 2 charts down), the year open is 1.3655, and the March and April lows are 1.3670. The short term wave count is shown below and 1.3530 remains initial support.
USDCAD 4 HOUR

USDCAD did turn up before giving up the majority of gains during the U.S. session. The triangle scenario remains favored but I’m tracking parallels within the short term bearish channel for a possible entry now. Notice how the 25 and 75 lines have acted as pivots…the 25 line was resistance today (symmetry!). If price breaks above this line then watch for support from the top side of the line. The arrows lay out a possible path…and that’s what I’m watching for entry.
10/3 – The USDCAD triangle that we’ve been following is still a possibility. However, price needs to turn up soon in order for the interpretation to remain valid. The August-September line is slightly lower. Also, VWAP resistance in CAD futures (USDCAD support) reinforces the level (see below). If a reversal unfolds, then I’ll plot an entry.
USDJPY 4 HOUR

USDJPY pulled back to the top of the noted zone and rebounded but as long as price is under overhead resistance, my view is that a 3 wave drop is underway towards 110.40/50, which is the bottom of the noted zone and where the drop would consist of 2 equal legs.
9/30 – USDJPY pulled back (glad we didn’t chase!) and focus for support is the noted 110.45/80. Basically, I’m looking to buy weakness into that zone on a show of support.
USDNOK DAILY

USDNOK reversed higher from the combination of trendline support, the 61.8% retrace of the rally from April, and the 200 day average. The 200 day average has been precise support/resistance for years! I’m bullish against this week’s low. FYI, long USDNOK is a short oil play and crude did reverse sharply lower today.


