Market Update 7/14 – Bearish Oil and CAD
CRUDE OIL FUTURES HOURLY

Short term waves suggest that crude has put in a lower high. Specifically, a 3 wave rally followed a 5 wave decline from a high. The implication is that another impulsive decline is underway. The March high at 68 is an initial level of interest on the downside. For context, the longer term chart is reproduced below.
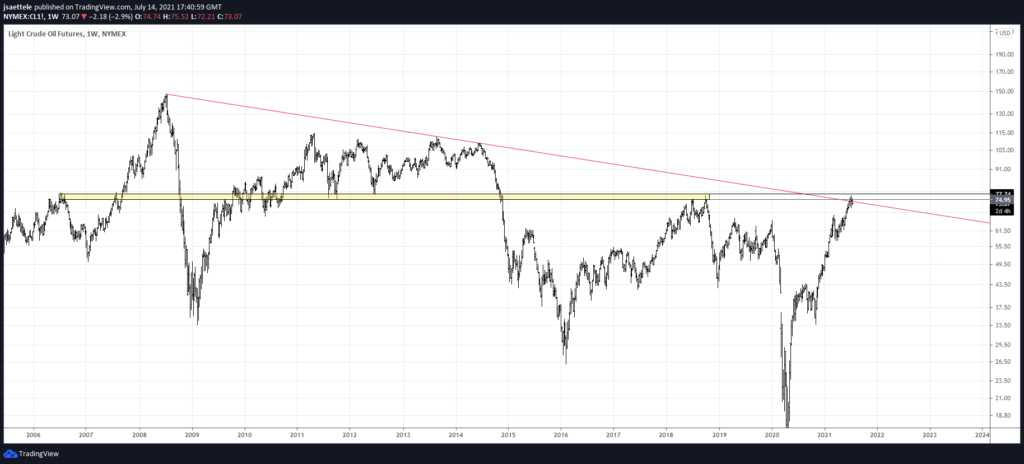
7/6 – Crude put in a massive reversal today. I love the ‘top on news (OPEC)’ dynamic, especially from this major price zone. Recall that this is the trendline from 2008 and a well-defined horizontal zone (see weekly chart below). I am bearish crude at this level.
CRUDE OIL FUTURES WEEKLY

USDOLLAR 4 HOUR

I’m torn on USDOLLAR here. The count above makes a compelling Elliott case for another leg up with action since the high as a 4th wave triangle. The upside zone is still 11980-12017. The line in the sand for this count is 11856. If that gives way, then I’ll lean towards a deeper drop towards 11804. Non-USD crosses might be the way to go right now without much of a view on immediate USD direction. More on that at the end of today’s post.
7/1 – USDOLLAR did pull back after the most recent note before resuming higher. Price is quickly approaching possible resistance in the 11980-12017 zone. The bottom of the zone is a parallel that has provided support and resistance for over a year (notice the symmetry on display with the supporting parallel) and the top of the zone is where the rally would consist of 2 equal legs.
DXY 4 HOUR

DXY is in a similar position USDOLLAR. An Elliott case can be made that strength from the 7/6 low is an ending diagonal. Under this scenario, DXY trades up to 93 or so before reversing lower. HOWEVER, note that the bottom of the zone noted a few weeks ago has been met (92.79…the high so far is 92.85). Under 92 would suggest that a deeper drop is underway with 91.50 as a first stop.
6/30 – Near term DXY upside focus is 92.79-93.02. The zone is defined by the median line of the fork that begins at the January low and the uncovered close from 4/5. It’s also the line off of the September and March highs. A break above would be extremely bullish given the STILL crowded short USD position. I’ll zoom in as price approaches the level but my initial thinking is that DXY completes a 5 wave rally into the noted zone and pulls back.
EURUSD 4 HOUR

Despite USDOLLAR and DXY comments, I’m of the mind that EURUSD put in a low today. The drop from 5/25 ‘counts’ in 5 waves and the level is extremely well-defined (trendline from November low). The high volume level from US CPI at 1.1800 is proposed support. Upside levels of interest are 1.1940/75 (median line and 6/25 high) and 1.2078 (61.8% retrace and 75 line…the low is on the 25 line so watch for that symmetry!).
7/13 – EURUSD is testing the line off of the November and March lows. It’s tempting to call a break below this line a ‘breakdown’ but price would still face the median line from the fork that originates at the February high. Let’s see what happens at the median line if reached. A bounce from there would set up a short at slightly higher levels and at a later date. A break below would set up a short immediately at the underside of the median line. The median line is about 1.1730.
USDJPY HOURLY

USDJPY reversed just before the noted zone but on the underside of former trendline support so I’ll adopt a bearish view against today’s high. Proposed resistance is 110.30/40. The target on this swing is 108.50s as 2 equal legs down from the high is 108.57 and the 5/25 low is 108.56.
7/13 – If a bigger top is in place for USDJPY, then price should turn down in the 110.85-111.02 zone. The bottom of the zone is the 61.8% retrace and the top of the zone is daily reversal resistance. This zone includes the March high and resistance from June.
EURCAD 4 HOUR

I love this EURCAD long setup. Price broke above the 2021 trendline on 7/8, pulled back and found support at the top side of that line (and the month open at 1.4705). The blue line extends off of the 2015 and 2020 lows (see daily chart below). Broad upside focus is the April high at 1.5193. 1.4770s (former resistance) is support. What’s more, the bearish oil view supports this idea (see 2 charts down).
EURCAD DAILY

EURCAD (BLUE) AND INVERSE OF CRUDE OIL (BLACK) DAILY CLOSES


