Market Update 7/13 – Get Ready for RBNZ and BoC!
S&P IT SECTOR PRICE/SALES

I showed the Nasdaq chart in yesterday’s update. Price didn’t quite reach the upper channel line but price did reverse today. A doji candle is left on the daily chart. I find this interesting in light of the above chart, which indicates that tech (by price/sales at least) is more expensive now than during the late 90s tech bubble.
EURUSD DAILY

EURUSD is testing the line off of the November and March lows. It’s tempting to call a break below this line a ‘breakdown’ but price would still face the median line from the fork that originates at the February high. Let’s see what happens at the median line if reached. A bounce from there would set up a short at slightly higher levels and at a later date. A break below would set up a short immediately at the underside of the median line. The median line is about 1.1730.
7/12 – EURUSD held VWAP from the 2020 low (again) so near term focus is higher towards the center line of the channel from the January high, which is about 1.1935. Importantly, notice that the 75 line provided support therefore the 25 line is proposed resistance if reached (as per median line symmetry). The 25 line intersects the 61.8% retrace of the decline from the May high at 1.2081. Watch for support near 1.1825.
USDJPY 4 HOUR

If a bigger top is in place for USDJPY, then price should turn down in the 110.85-111.02 zone. The bottom of the zone is the 61.8% retrace and the top of the zone is daily reversal resistance. This zone includes the March high and resistance from June.
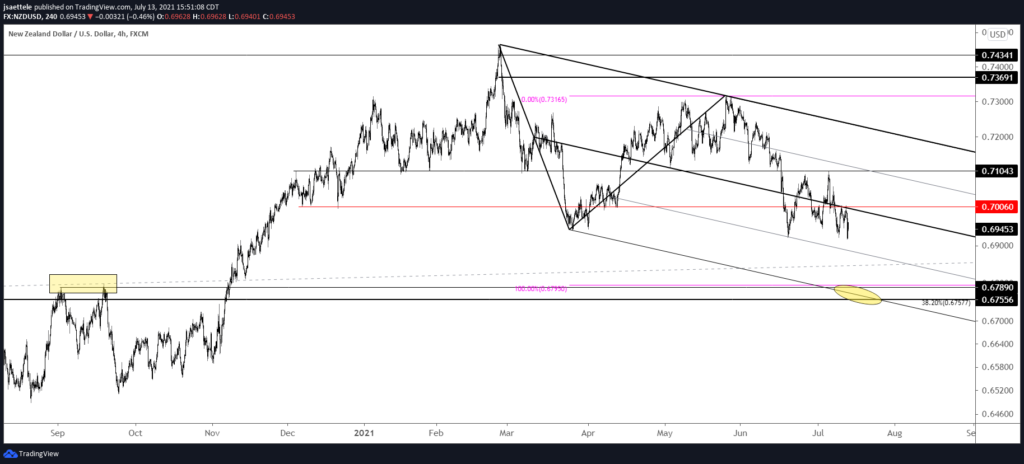
NZDUSD 4 HOUR

Kiwi continues to play out beautifully. .7000 has provided resistance the last 3 days and focus remains on .6750-.6800. RBNZ is tonight (Wednesday in New Zealand) so it’s possible that we get a flush into .6800 or so before a rebound. For us, this sets up a possible opportunity to flip from short to long.
7/8 – NZDUSD took out .7100 before plunging…that’s annoying. In any case, focus remains on .6750-.6800. This zone is loaded with former resistance, 2 equal legs down, the 38.2% retrace from March 2020, the lower channel line, AND VWAP from the 2020 low (see below)! If price bounces here then .6985-.7000 is well-defined for resistance. .7000 is the median line and high volume level from 7/6.
USDCAD 4 HOUR

BoC is also on Wednesday. This USDCAD chart is a perfect example of median line symmetry. The 75 was resistance and the 25 line was support! Price is testing the median line now. I’m bullish heading into the event with risk under today’s low. 1.2650-1.2730 remains a target/resistance zone. The upper parallel from the channel is about 1.2695. 1.2482 (high volume level) is now proposed support.
7/8 – USDCAD is fast approaching the important 1.2650-1.2730 zone. The bottom of the zone includes the 200 day average and upper channel line of the channel from the low. If price is going to get there quickly then former resistance at 1.2495 should provide support. Canadian employment is on Friday.
USDZAR DAILY

USDZAR has broken out from an inverse head and shoulders pattern and above the trendline from April 2020. 14.51 is now proposed support. The level has been support and resistance since December. It’s also the neckline from the aforementioned head and shoulders. Upside focus is 15.65 (38.2% retrace from April 2020 and January high).


