Market Update 2/24 – Extreme RSI Edition
U.S. GOVERNMENT 30 YEAR YIELD

The 30 year U.S. yield is one of the purest representations of the ‘inflation trade’. The yield bottomed in March (along with everything else) right at the full extension from the channel that originates at the 1987 high. I’ve misjudged the speed and strength of the rally but 2.44 looms as the biggest test since the low. This is the center line of the noted channel and the November 2019 high. A move back to the lower parallel, which has been significant, wouldn’t surprise. That is about 1.69. A zoomed in chart is below.
U.S. GOVERNMENT 30 YEAR YIELD

TLT DAILY

TLT tagged the March low today (also the 2015 high). Big spot. RSI is 20.97. Readings this low (magenta dots) are rare and have occurred either at or just before big lows (see the chart below as well). Remember, lower TLT indicates higher yield and higher TLT indicates lower yield. In other words, this chart ‘fits’ with the 30 year yield chart.
TLT DAILY

COPPER WEEKLY

Copper is another pure inflation trade asset. Price is closing in on the underside of the long term trendline (log scale) that was resistance in 2017 and 2018. Daily RSI is almost 88! Readings this high have occurred at or near price tops except for April 2006, when copper dropped for 2 weeks before going into a blowoff.
COPPER DAILY

COPPER DAILY

USDTRY 4 HOUR

USDTRY is following the script thus far. The top side of the broken wedge line is proposed support near 7.0830. I’m looking to buy a test of that level.
2/23 – USDTRY price action from the November top may compose a rare leading diagonal (wedge). Price is pressing against the upper wedge barrier. A break above would confront the 200 period average on the 4 hour chart as resistance. The setup would be to buy a re-test of the top side of the wedge line. If the leading diagonal interpretation is correct, then USDTRY likely retraces a significant portion of the decline from November…61.8% to 78.6% of the drop. That’s a big move.
AUDJPY DAILY

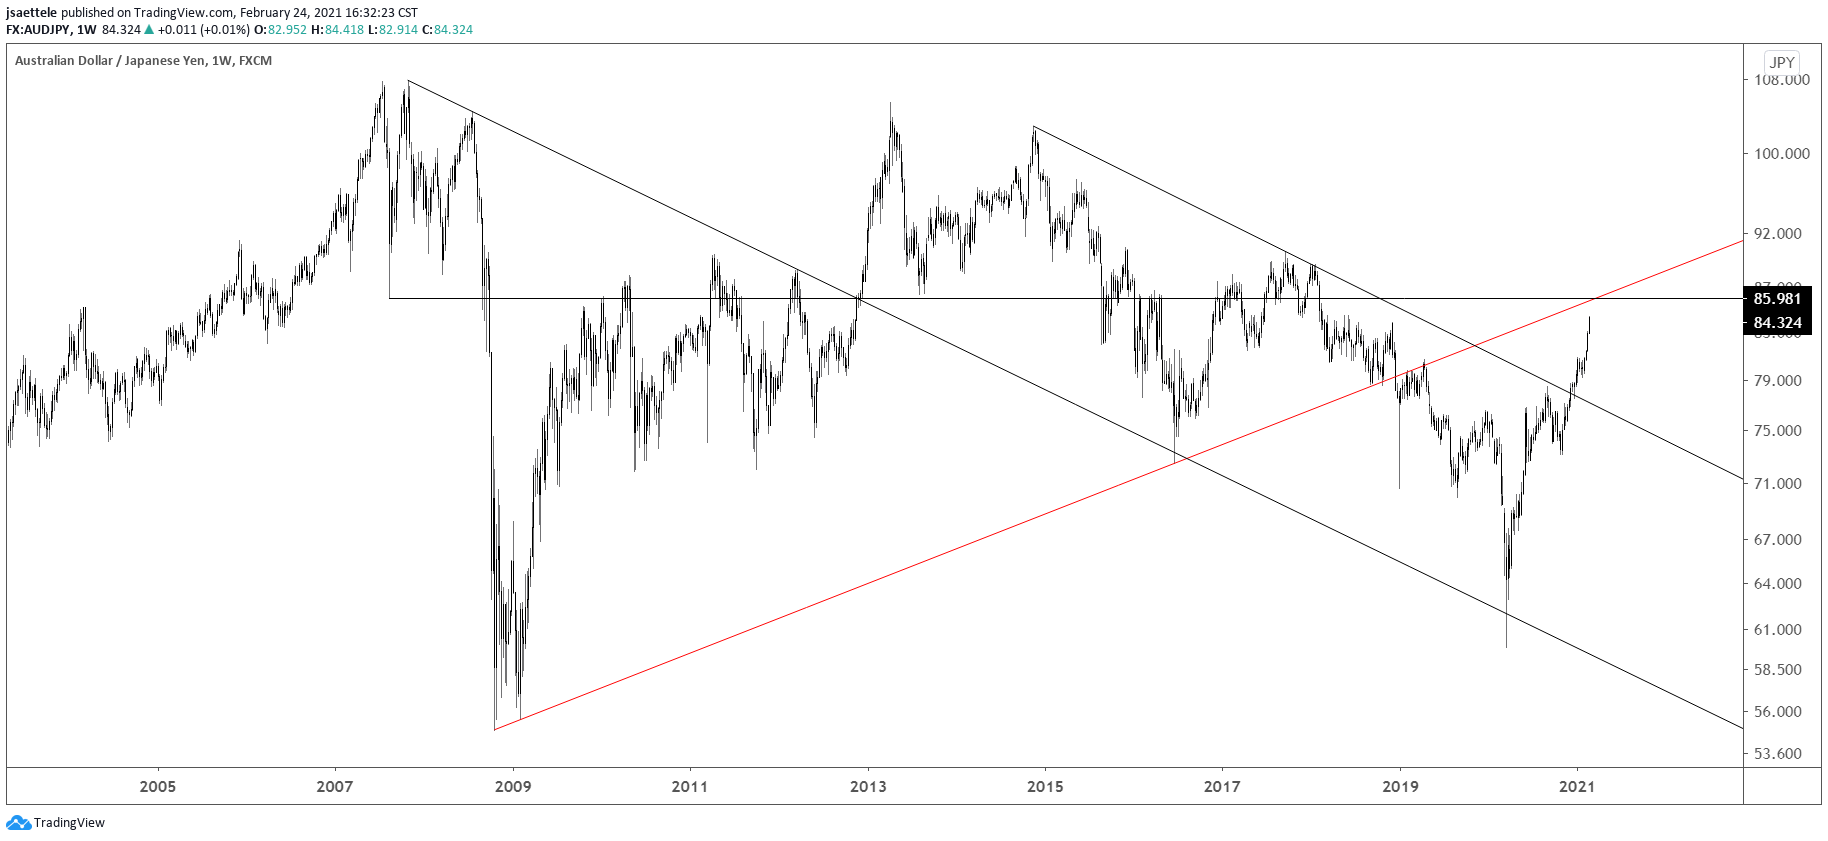
AUDJPY is nearing the line off of the 2008 and 2016 lows. This line was support in October 2018 and resistance in early 2019 so watch for resistance there again. The line is about 85.80. Daily RSI is 83.6 (see the next 2 charts), which has only been reached once before, in December 2005. Price topped then and fell over 6 big figures in the next 2 weeks.
AUDJPY DAILY

AUDJPY DAILY

GBPCHF DAILY

GBP crosses are at interesting levels. GBPCHF is testing the confluence of the channel from the March low and trendline from the 2018 high. This is purely an observation that price is at an important level and could ‘revert to the mean’ a bit. If price does pull back then support is probably the median line near 1.2370.
GBPCAD DAILY

GBPCAD is a more interesting trade idea than GBPCHF on the short side following today’s reversal. Resistance up here is well-defined from the trendline that originates at the 2018 high, center line of the channel from the 2019 low, and a clear horizontal zone. Bigger picture, bullish potential is significant however from the massive double bottom with the 2016 and 2019 lows. Downside focus in this instance is probably 1.7350. Watch for resistance for short entry near 1.7780.


