Market Update – September 18
Dollar Lifted After Fed Signals No Rate Hikes for Years
September 17, 2020Market Update – September 21
September 21, 2020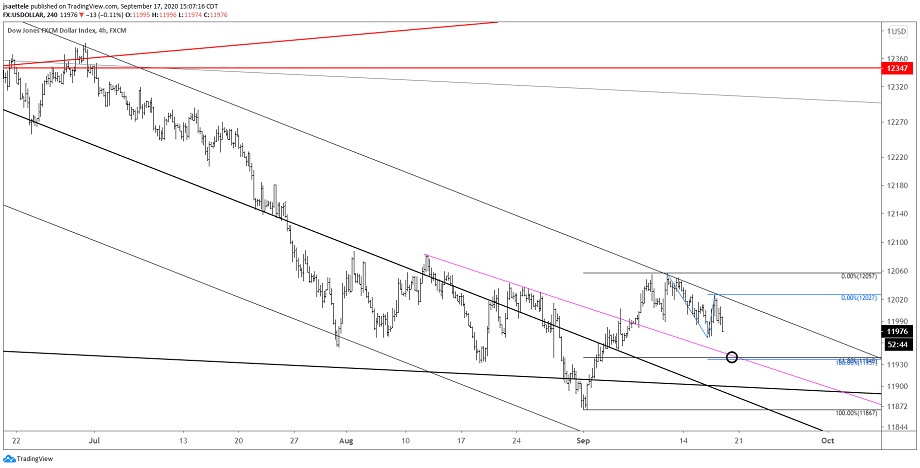
USDOLLAR 4 HOUR
USDOLLAR failed yet again at the upper parallel from the Schiff fork off of the March high. Pay attention to 11940, which is 2 legs down from the 9/10 high and the 61.8% retrace of the rally from the 9/1 low, for support. This is also near the 8/19 low and top side of the line that crosses highs in August (magenta line).
9/9 – USDOLLAR has yet to break above 12087 and the rally has failed so far a the upper parallel from the Schiff fork off of the March high. I’m still leaning towards action since 7/31 as a base that price will work higher from. Watch for support now near 11973. The behavior change in 4 hour RSI is worth noting. RSI registered an ‘overbought’ reading on this advance (see below chart). In downtrends (depends on the scale of course but I 4 hour is compatible with my style for 24 hour markets), RSI tends to register readings below 30 at price lows but does NOT register overbought readings at price highs. In fact, RSI will often top near 60 on counter-trend rallies. The opposite is true in uptrends…readings above 70 at price highs and readings above 30 (often near 40) at price lows. With this in mind, USDOLLAR is no longer in a downtrend (on the 4 hour chart) but either in a sideways or uptrend.
GBPUSD 4 HOUR

GBPUSD bounced from just under the 6/10 high at 1.2814. Price is currently trading in ‘no man’s land’ but 1.3170 sticks out as significant resistance. This level is defined by the underside of the median line from the fork that originates at the September 2019 low. The spot to know for proposed support (maybe a few weeks out) is the 25 line of that fork, which was support in May and June, near 1.2580.
EURUSD DAILY

EURUSD took out 1.1750, got bears (me) excited, and then reversed ALL post FOMC losses to finish the day back to the FOMC spike high. Price has traded sideways since 7/31, nearly 2 months, and it’s frustrating. The action is similar to the topping formation in early 2018, which lasted 3 months. Hopefully, this range does not persist for another 6 weeks but it’s a possibility to be aware of. A close up view is below.
9/16 – Today’s high was on the underside of the line of former channel support from the 5/14 low (only the lower parallel is shown on this chart). Is this the final ‘kiss’ goodbye for EURUSD? It’s of course promising from a bearish perspective that the upper parallel has continued to provide resistance as well. Below 1.1750 is still needed in order to confirm the breakdown and set a near term bearish target of 1.1490. The lower parallel from the bearish fork intersects this level on Monday.
EURUSD DAILY

EURJPY HOURLY

EURJPY low today was on the 75 line of the short term bearish fork. As such, respect potential for strength into the 25 line (concept of symmetry), which has been a pivot throughout the month anyway. The 25 line is about 124.80, which is near the 200 hour average.
9/16 – EURJPY confirmed the month long topping pattern today and focus is on the mentioned 121.80. Resistance should be the breakdown level (former support and the June high) at 124.40.