Market Update 10/20 – Extreme Daily RSI in Several Yen Crosses
USDOLLAR DAILY
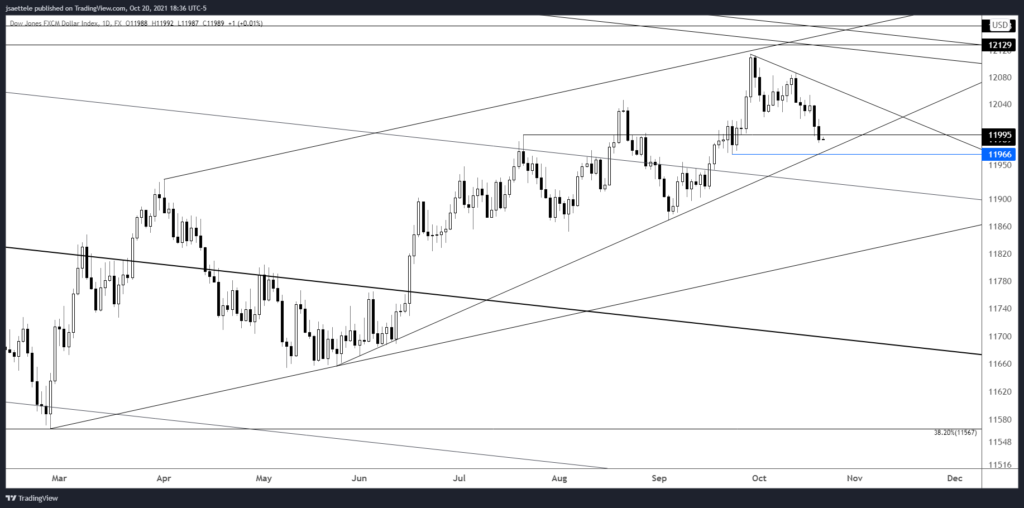
So much for ‘one more leg up’! USDOLLAR has dropped 5 of the last 6 days. The current level down to 11966 is defined by the July high, 9/23 low, and trendline that crosses lows in May, June, and September. This is a decision point so watch for a bounce. If the trendline breaks then there is nothing until the April high at 11929.
10/12 – News headlines are the exact opposite as the ones that appeared early in the year when the USD was bottoming. See Dollar Looks Unstoppable as Taper Looms and Energy Prices Soar for example. USDOLLAR is trading just beneath our long term target of 12130/60 so be aware of the potential for one more leg up before a reversal attempt. That said, I’m am paying attention to 12090 for possible resistance over the next few days. This is 2 equal legs up from the 10/4 low.
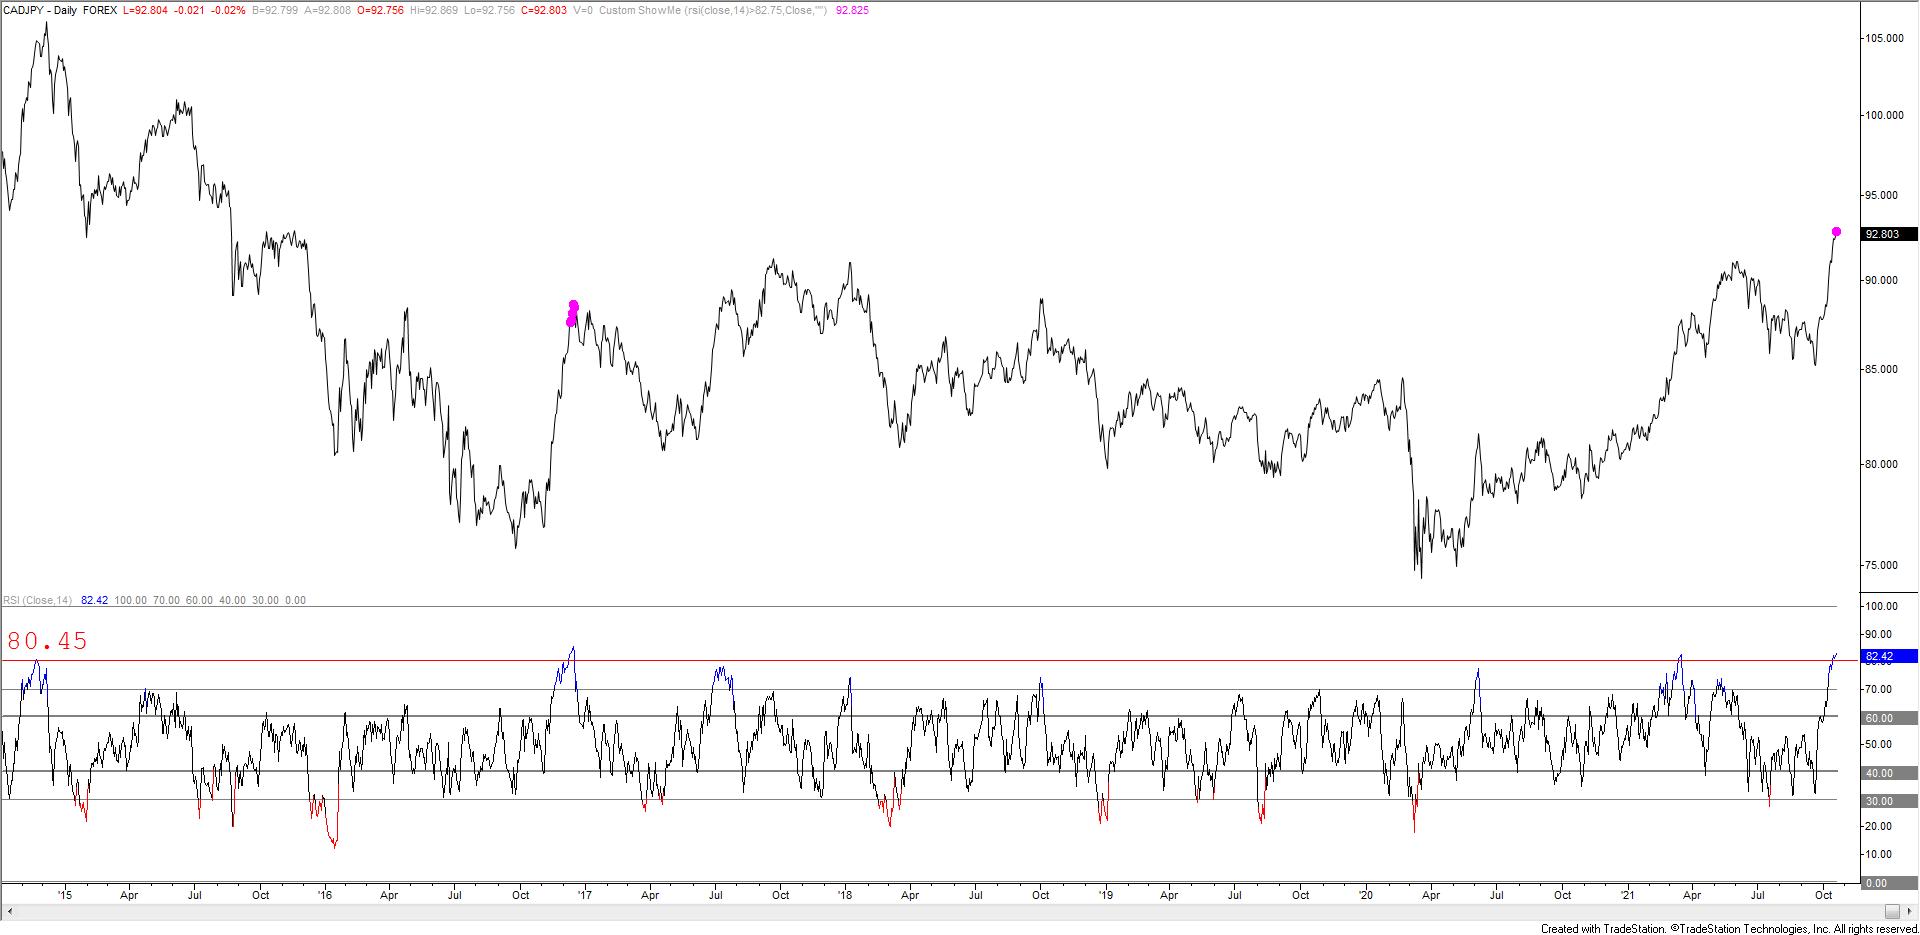
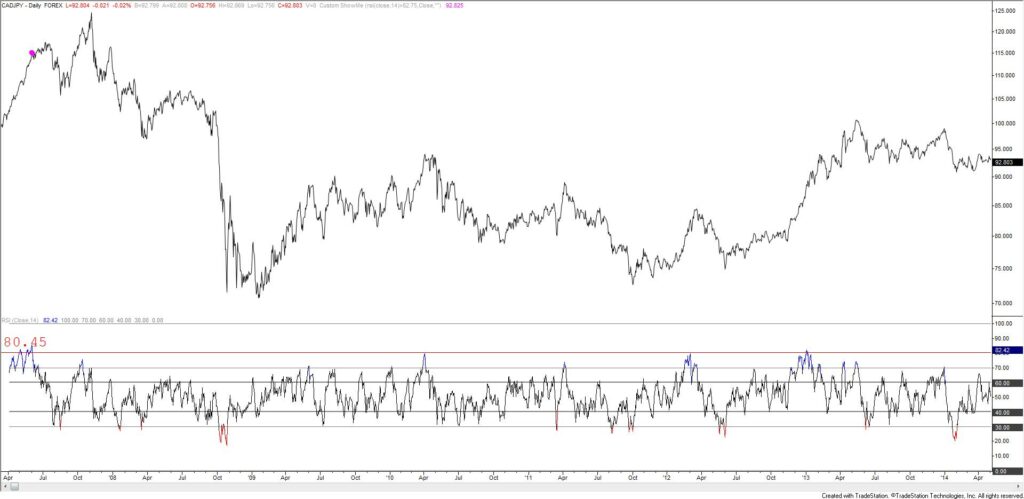
CADJPY DAILY
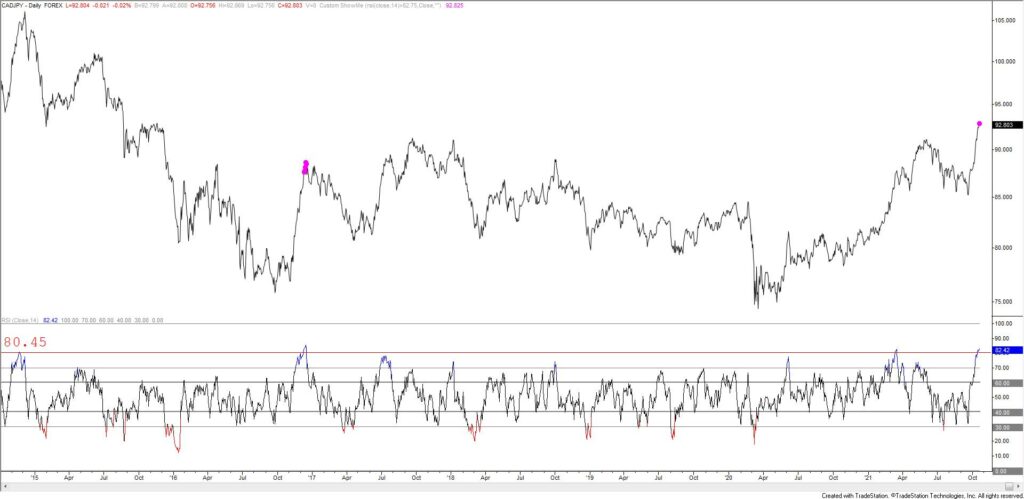
CADJPY RSI closed at 82.79 on Wednesday. CADJPY data on TradeStation only goes back to 2007 but readings this high since then have only occurred several times since then; in December 2017 and June 2007 s(see below)! Bottom line, a reading this high is rare and therefore at risk of a reversal. Price wise, 93.25-94.50 is a zone to pay attention for a resistance and a high (see 2 charts down).
CADJPY DAILY
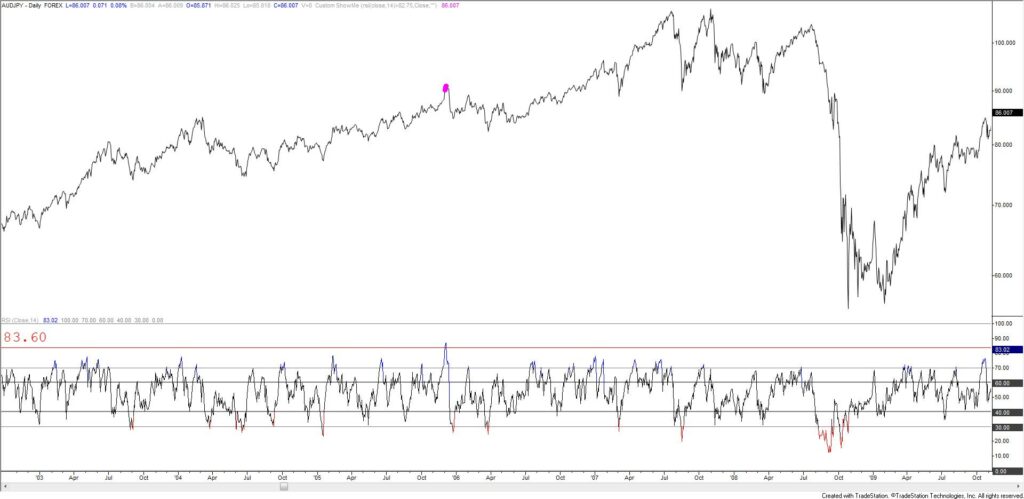
AUDJPY DAILY
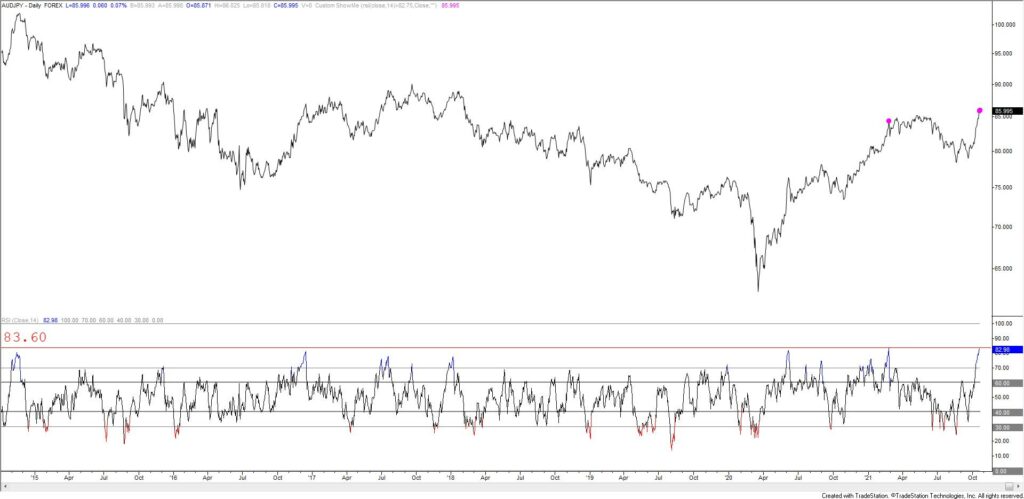
AUDJPY daily RSI also closed right at 82.79 on Wednesday (the exact same reading as CADJPY). Readings this high are rare. Here’s the list – now, 2/24/21, 9/5/2014, 12/18/12, and early December 2005. Even the 2012 instance led to a 3 day pullback. Bottom line, RSI is in ‘rarefied air’ and therefore at risk of a snap back. I’ll alert in the event of reversal evidence. The historical charts are shown below.
AUDJPY DAILY
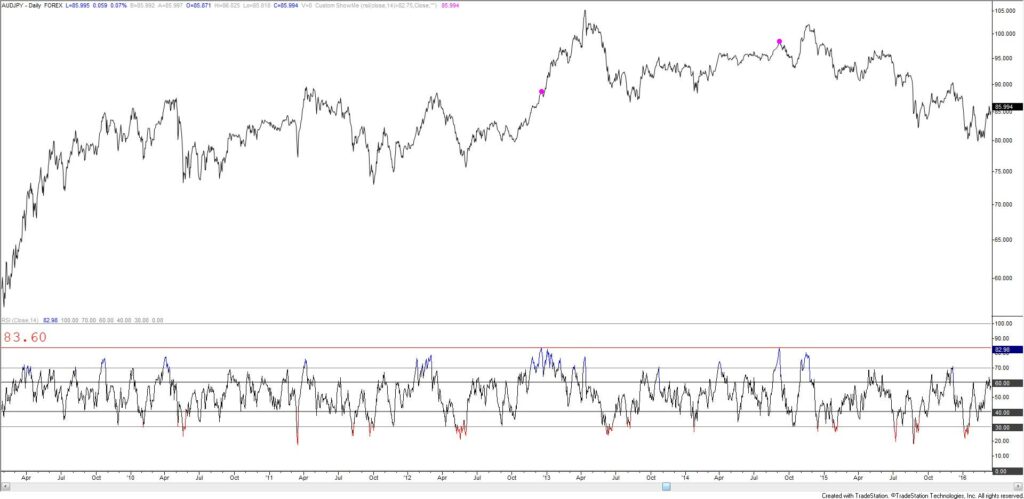
AUDJPY DAILY