
Market Update 6/22 – BTCUSD Reversal and USD FX Nearing Support
BTCUSD DAILY
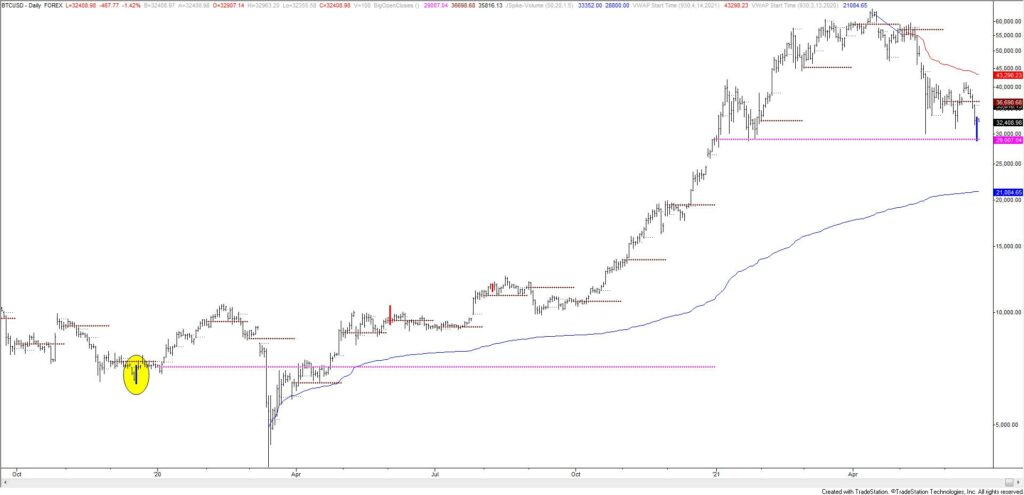
BTCUSD reversed higher today from the year open price of 29007. The reversal was accompanied by high volume (J Spike Volume). This is the second such signal since 2018 (note the December 2018 signal which is circled). Given the reversal from the month open, I’m bullish against today’s low. 42000-44000 is proposed resistance again.
6/14 – BTCUSD is still playing out in perfect Elliott form as price nears the noted zone of 42000-44000. The rally would consist of 2 equal legs at 42451 and the 38.2% retrace is 43963 (don’t forget about last week’s observation regarding 38.2% retraces in BTCUSD after plunges from record highs). Bottom line, we’re looking for the next high soon.
EURUSD 4 HOUR

Elliott analysis is a method of pattern classification. Price patterns are the manifestation of human psychology (sentiment), which is clarified with increased volatility. Such clarity is on display now in EURUSD. 1.1880 was support today for proposed wave B and the rally from that low is wave C. The rally could be complete now since strength consists of 2 equal waves but I’d still allow for a test of 1.1990. Bottom line, I’m bearish but respecting potential for 1.1990.
6/21 – EURUSD has indeed bounced which keeps us on 1.1990 for resistance. I’m thinking that today’s rally is wave A of an A-B-C rally so expect a pullback in wave B before a C wave rally into 1.1990. Proposed wave B support is 1.1880s. Tactically, I prefer shorting into 1.1990.
GBPUSD 4 HOUR

1.4000/10 remains ideal resistance for GBPUSD. Aside from ‘clean’ horizontal resistance and the 25 line of the Schiff fork from the March 2020 low, it’s also 2 equal legs from the low.
6/21 – GBPUSD turned up prior to the proposed 1.3740 but 1.4000 remains in line for resistance. Besides being ‘clean’ horizontal resistance, the level is also defined by the 25 line of the Schiff fork from the March 2020 low. This line was support in December and April…so watch for support to turn into resistance.
AUDUSD 4 HOUR

No change to AUDUSD but I wanted to reproduce the chart in order to convey the importance of .7610 resistance. II will note that a 12 hour (half day) volume reversal triggered on the low (see futures chart below). Previous signals have identified swing lows of varying degrees so if the rally from the low unfolds in 5 waves then I’ll flip to a bullish stance.
6/21 – Downside AUDUSD focus remains .7415 (of course!) but a bit more strength would present an opportunity to short into the center line of the channel from the YTD high. That line is about .7610, which is also the high volume from FOMC last week.
AUSTRALIAN DOLLAR FUTURES 12 HOUR

NZDUSD 4 HOUR

NZDUSD is at noted resistance now so I’m looking for price to roll over. Again, the level is noted by the center line from the channel since February, 2 equal legs up from the low, and the 38.2% retrace of the decline from 6/7.
6/16 – NZDUSD broke the ‘critical .7100‘! That is now proposed resistance and a level to increase size if reached. The 200 day average is a possible bounce spot at .7030 although broader focus remains .6750-.6800 (2 legs down from the high, 38.2% retrace from the 2020 low, and resistance from September).
USDCAD HOURLY

Focus for USDCAD support is 1.2260s. This is 2 equal legs down from the high, the top side of the former short term channel (a test and hold of that line triggers a slingshot setup), and the high volume level from FOMC last week.
6/16 – USDCAD confirmed a ‘slingshot’ setup today. That is, price broke above a bullish channel. The upper parallel from that channel is now proposed support near 1.2210. The next decision point is the trendline from April 2020. That line is about 1.2400 now but be aware of the March low at 1.2365.
EURJPY 4 HOUR

The underside of former trendline support (red line that originates at the November low) is in line for resistance near 132.60, which is also the 6/14 low. The 200 period average on the 4 hour chart is just above that level. Bottom line, I’m looking to short into 132.60/80s.
6/17 – EURJPY broke the wedge today and traded down to the well-defined 131.00. A move back to 132.30s might be asking too much but that’s the setup (shorting the underside of the wedge line). General focus is on the March low at 128.29. The 200 day average will coincide with that level over the next few weeks.


