Market Update 6/21 – Tracking USD Support Slightly Lower
EURUSD DAILY
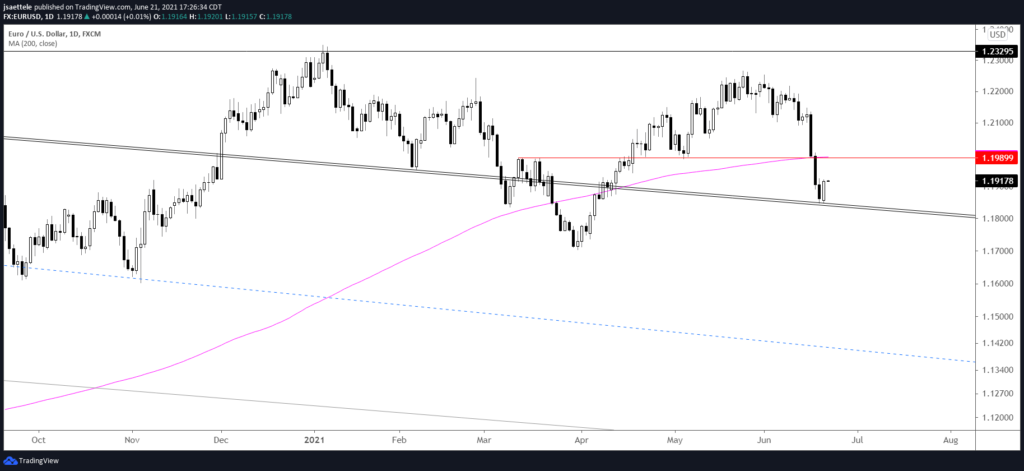
EURUSD has indeed bounced which keeps us on 1.1990 for resistance. I’m thinking that today’s rally is wave A of an A-B-C rally so expect a pullback in wave B before a C wave rally into 1.1990. Proposed wave B support is 1.1880s. Tactically, I prefer shorting into 1.1990.
6/20 – 1.1850…here we are! IF EURUSD is going to bounce then it should attempt as much at this level, which is defined by the top side of the 2008-2014 line (see weekly chart below). The median line from the fork that originates at the January high is about 1.1800. So, 1.1800/50 is the bounce spot. I remain a USD bull (EURUSD bear) and prefer to short strength after the violent move last week. 1.1990 is in line for resistance now. Let’s see if the market allows as much though.
GBPUSD DAILY
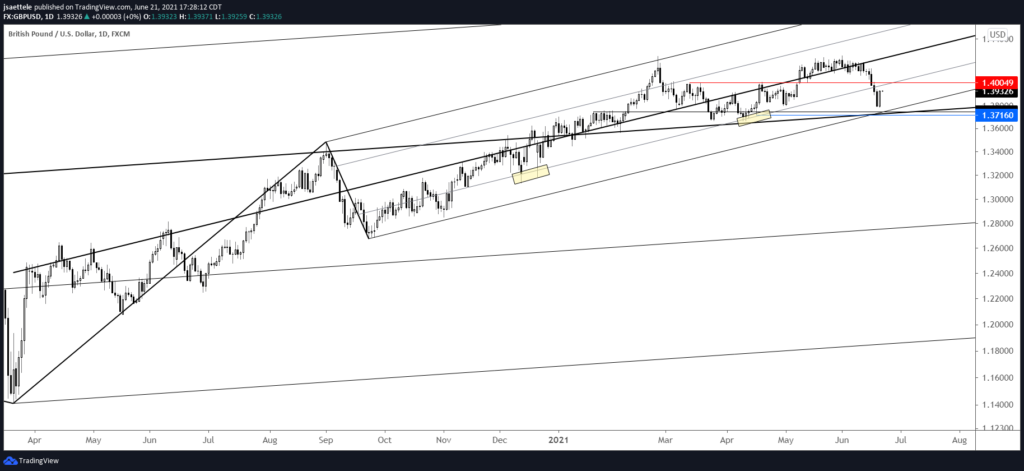
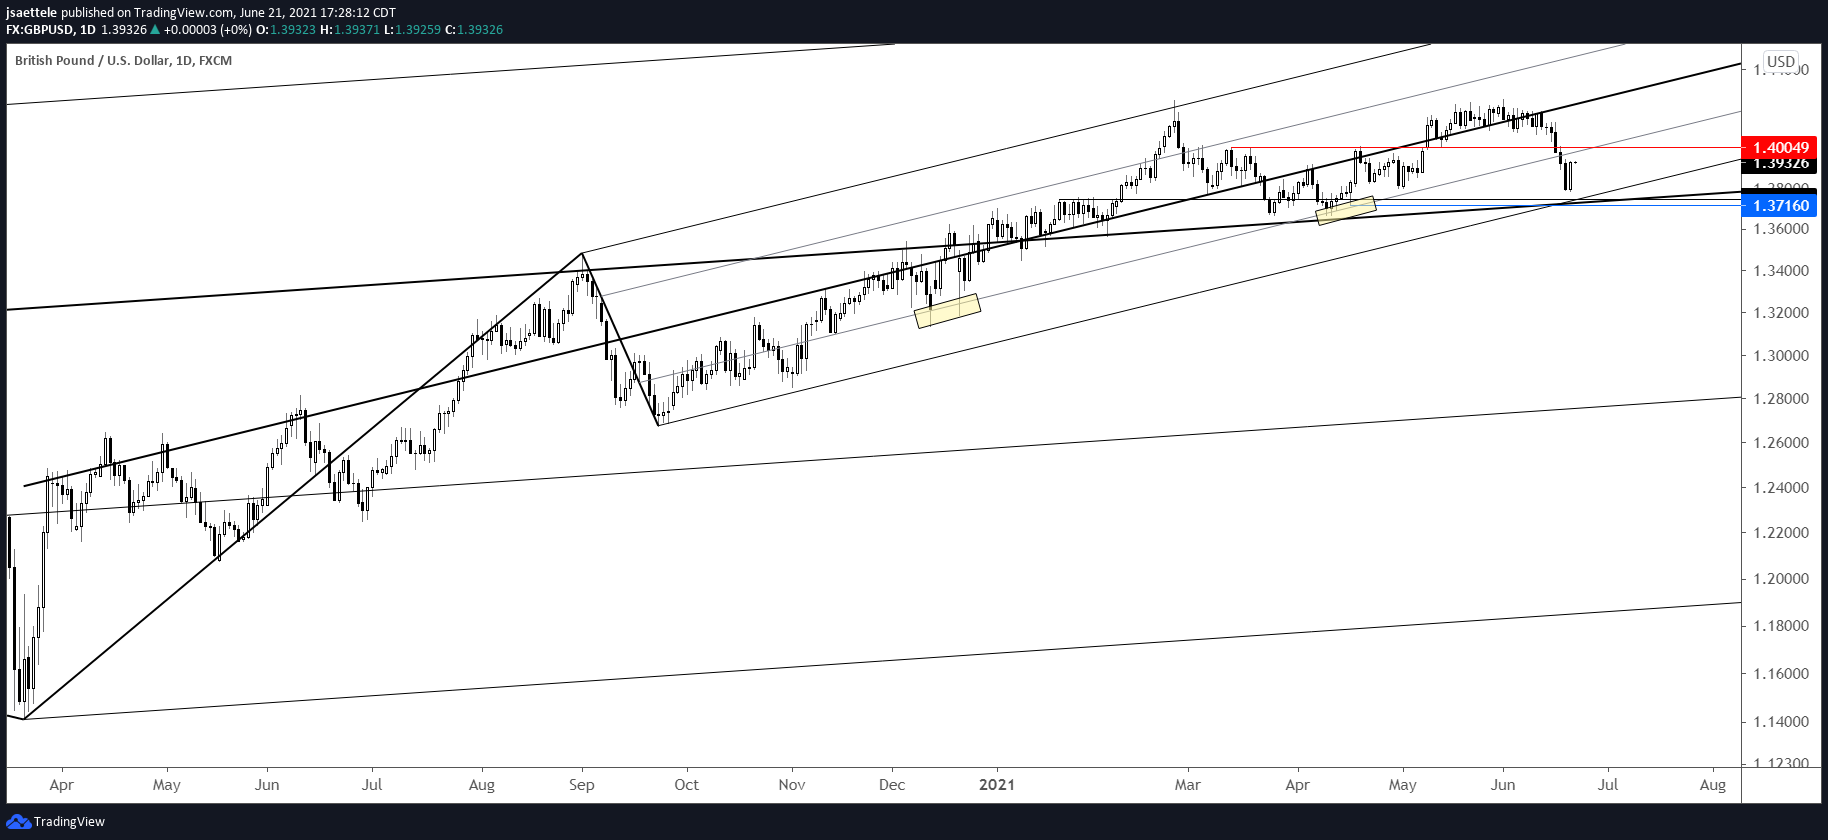
GBPUSD turned up prior to the proposed 1.3740 but 1.4000 remains in line for resistance. Besides being ‘clean’ horizontal resistance, the level is also defined by the 25 line of the Schiff fork from the March 2020 low. This line was support in December and April…so watch for support to turn into resistance.
6/20 – The ‘ideal’ trading levels for Cable remain the same. That is, 1.3740 (or so) and 1.4000 are the proposed ‘decision points’ although I’d widen the zone for a bounce to 1.3715/40. A zoomed in chart is below.
AUDUSD 4 HOUR
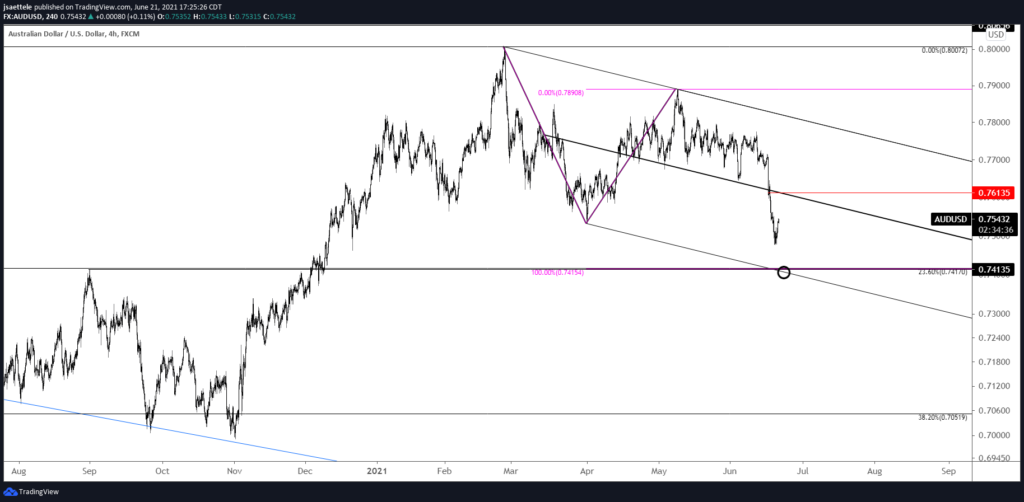
Downside AUDUSD focus remains .7415 (of course!) but a bit more strength would present an opportunity to short into the center line of the channel from the YTD high. That line is about .7610, which is also the high volume from FOMC last week.
6/17 – AUDUSD is well on its way to the long held target at .7415. The center line of the channel from the YTD high is now resistance near .7620. Keep it simple.
AUDJPY 4 HOUR
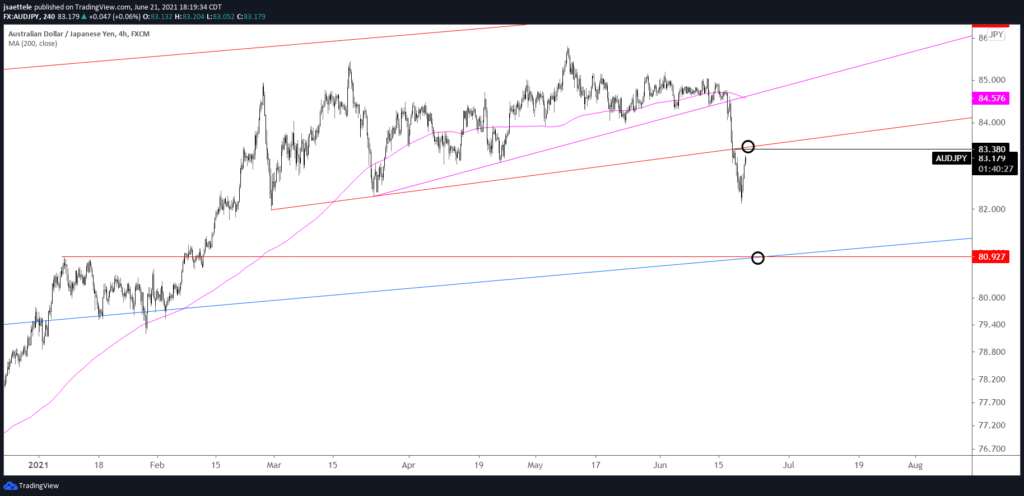
Don’t let the reversal scare you. Downside focus remains firmly on 80.90s. The underside of the line off of the 2/26 and 3/24 lows should provide resistance now near 83.40.
6/20 – AUDJPY is playing out beautifully. The underside of the line off of the 2/26 and 3/24 lines is now proposed resistance at 83.40. The next spot to pay attention to for possible support is 80.90s, which is resistance from January and the top side of the line that extends off of the December 2019 and August 2020 highs. This is essentially a neckline from a major bottoming pattern and therefore should be paid close attention.

