Market Update 6/17 – Yen about to Take Over?
USDOLLAR WEEKLY

USDOLLAR is at the ‘possible pullback level’ now (it’s 11855 as I type). Does it pull back? I don’t know but it’s also worth noting that price is at the 50 week average. My view remains that the USD is headed higher and that pullbacks are buying opportunities. I wouldn’t be surprised if price pulled back from the current level (maybe slightly higher). If it does then I’ll zoom in to identify precise support.
6/17 – Today’s move in USDOLLAR proves us correct in the assertion that action since the beginning of the year is a bullish base. The top side of the median line is now support near 11767. A pullback is possible from the center line of the channel from the yearly low. That line is near 11848. Strategically, either wait for a pullback to 11767 or a break above 11848 (median line) and then look to buy a pullback into 11848 (or so).
EURUSD WEEKLY

It looks like the noted 1.1850 is the spot to watch for a EURUSD bounce. I’m showing the long term chart to display the 50 week average and top side of the channel from the 2008 high. I continue to favor downside but 1.1850 (or so) is a great place for a bounce. If that breaks then it’s time to reassess. 1.1990 is ideal resistance to short now. A 4 hour view is below.
6/16 – Here we are at 1.1990. If we bounce here then 1.2050/60 should provide resistance. Initial downside focus is the lower parallel from the channel that originates at the March 2020 low. That’s about 1.1850 (see the daily below).
EURUSD 4 HOUR

GBPUSD 4 HOUR

GBPUSD is testing 2021 VWAP (see 2 charts down) so respect bounce potential. 1.4000 should provide resistance now. Aside from being a well-defined horizontal level, 1.4000 is also ‘slingshot’ resistance. Recall that a slingshot setup occurs when price breaks the channel and then re-tests the opposite side of that channel in the direction of the trend. Downside focus is 1.3740s (longer term slope confluence…see below).
GBPUSD DAILY

BRITISH POUND FUTURES DAILY

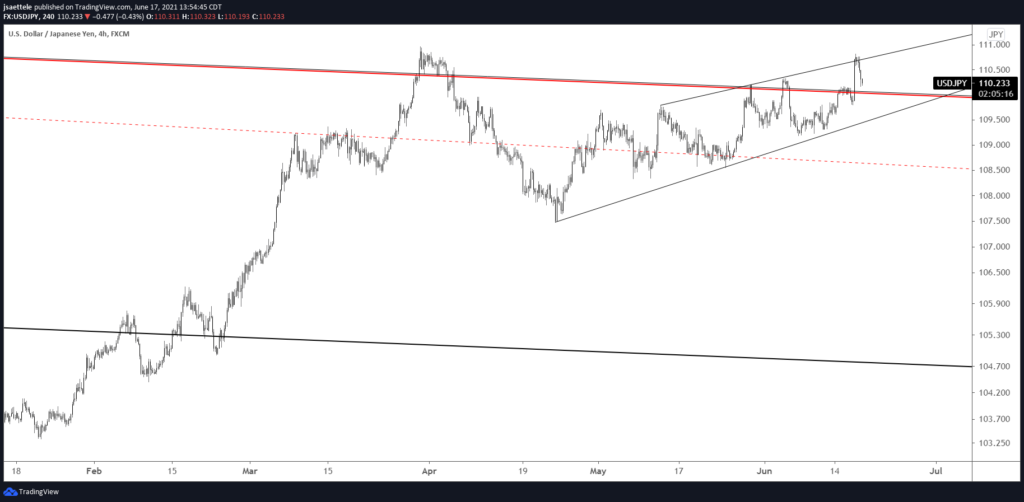
USDJPY 4 HOUR

It was pure risk-off in FX today as Yen was the only major that strengthened against the USD. I ‘like’ downside in Yen crosses generally, especially given the volume reversal today (see futures chart below…bullish Yen reversals since 2014 are highlighted). Price action from the April low takes the form of a wedge. The lower wedge barrier is about 109.50. The high volume level from FOMC is now proposed resistance at 110.50.
JAPANESE YEN FUTURES DAILY

AUDUSD DAILY

AUDUSD is well on its way to the long held target at .7415. The center line of the channel from the YTD high is now resistance near .7620. Keep it simple.
6/16 – AUDUSD has dropped into the noted .7616. If price bounces (good spot for it), then resistance should be .7645/75. Downside focus remains the long cited .7415.
EURJPY DAILY

EURJPY broke the wedge today and traded down to the well-defined 131.00. A move back to 132.30s might be asking too much but that’s the setup (shorting the underside of the wedge line). General focus is on the March low at 128.29. The 200 day average will coincide with that level over the next few weeks.
6/10 – 133.600 did provide resistance so I’m looking lower in EURJPY until the trendline from the October low, which is about 132.00 and in line with the 50 day average (see below). A break below 132.90 would also set a head and shoulders objective at 131.74. So general focus is on 131.70-132.00.


