Market Update 11/14 – British Pound VWAP Support Reached
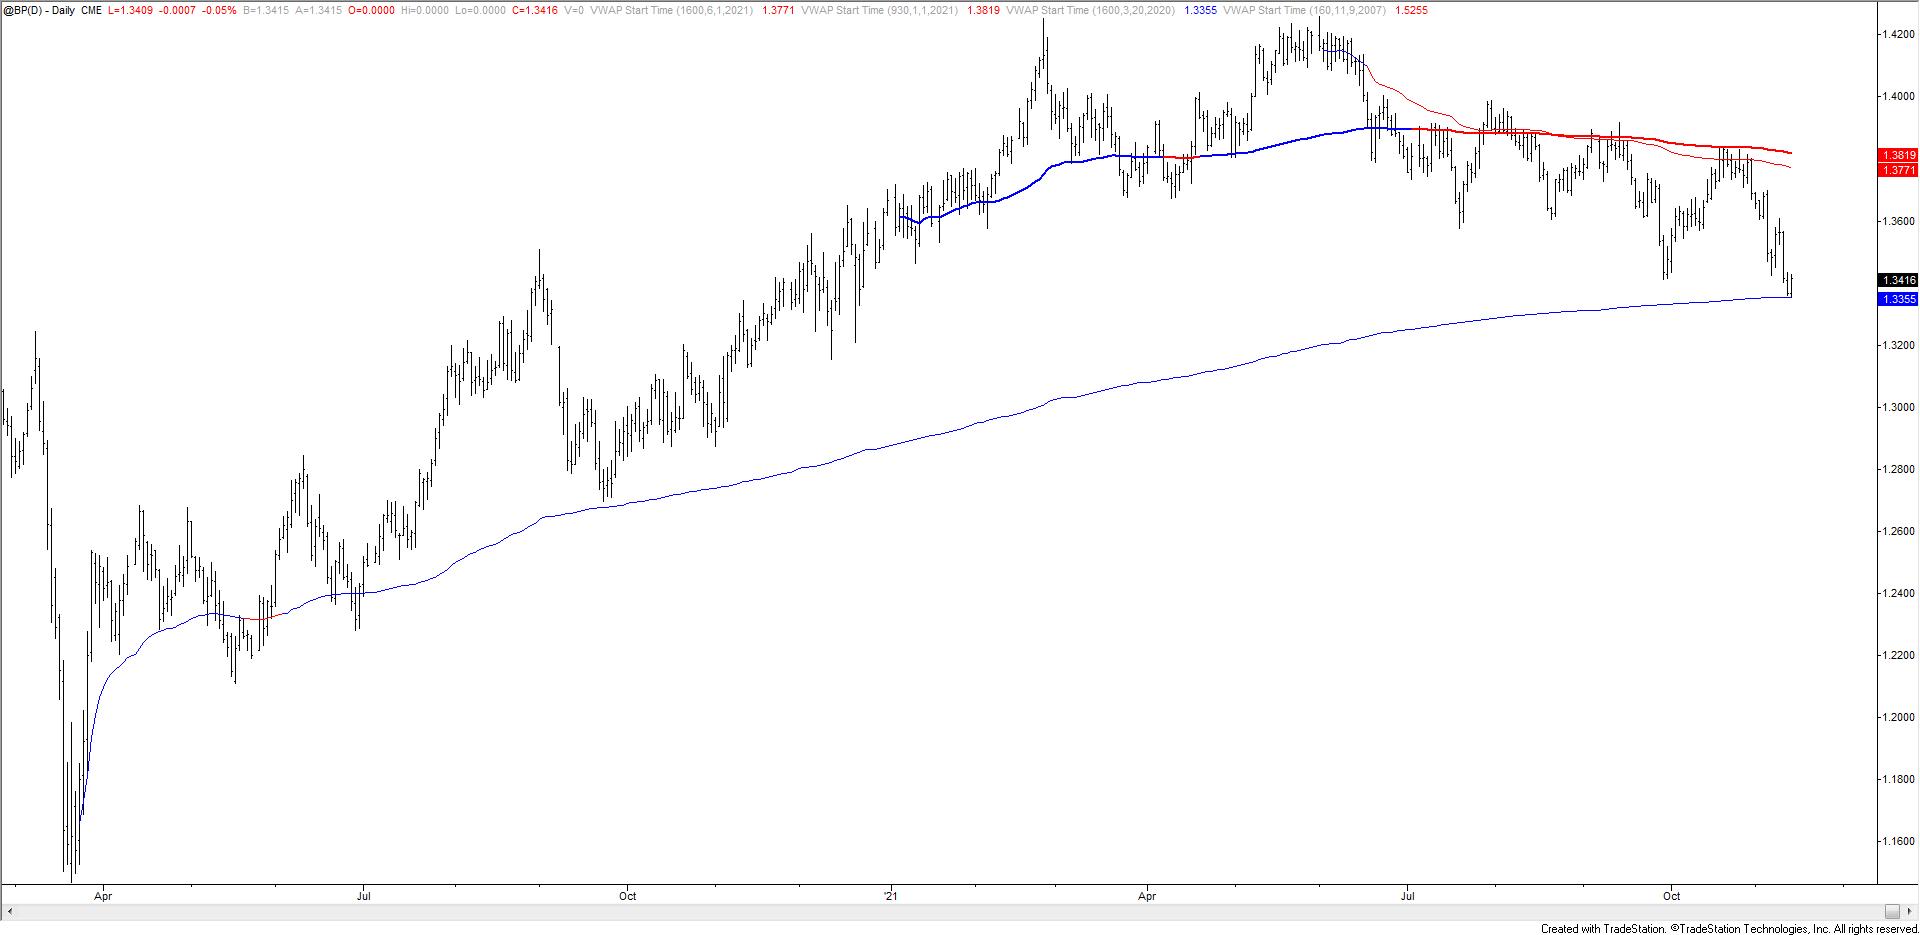
BRITISH POUND FUTURES DAILY
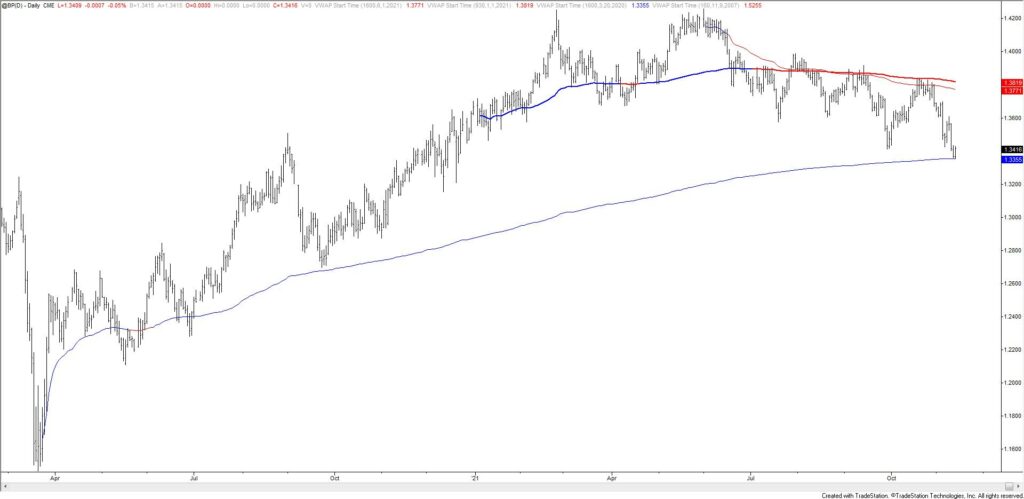
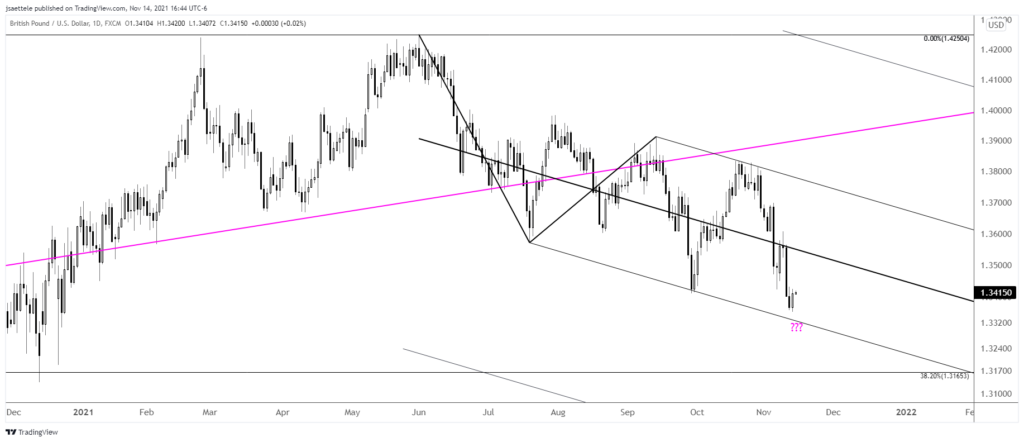
GBPUSD held VWAP from the March 2020 low on Friday. As noted last week, lower parallel support is slightly lower near 1.3320 (see below) though. If the rally from last week’s low extends into a small 5 wave advance then I’ll want to but a small dip.
11/11 – GBPUSD looks like death. That said, price could bounce from the lower parallel near 1.3325. A break below the parallel however would leave Cable in extremely dangerous territory and present a big bearish opportunity. If price breaks below, then the underside of the line becomes proposed resistance and the target would be 1.2830. I’ve outlined a possible path.
GBPUSD DAILY
USDCHF 4 HOUR
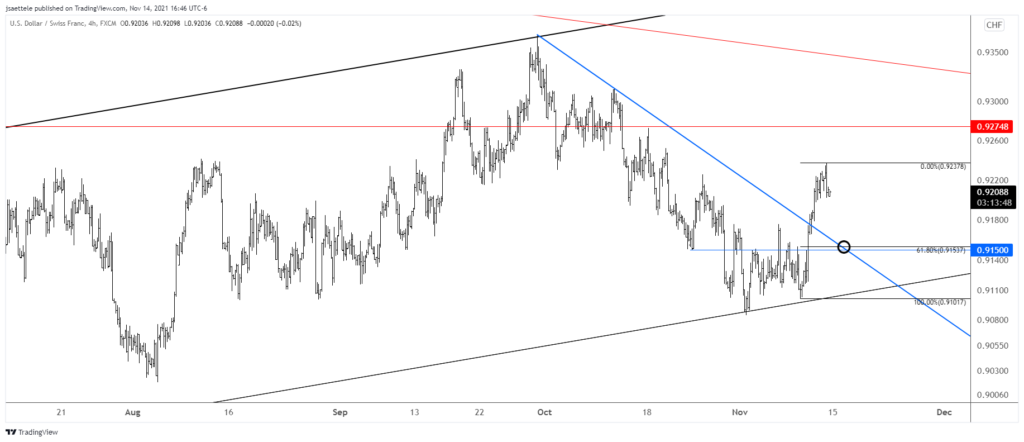
USDCHF took out .9220s on Friday and pulled back. As such, .9150 is in line for support and a long entry. The big upside level of interest (eventually) is the trendline from the 2019 high (red line) near .9340.
11/10 – USDCHF was the ‘tell’ all along. I didn’t pay close enough attention. Anyway, a much bigger move could be getting underway. Near term levels to note for resistance and support are .9220s and .9150. The BIG spot to keep in mind is the trendline that originates at the April 2019 high near .9350. A longer term chart is below.
Do you make a profit trading USDCHF?
If you’re a consistently profitable trader, consider joining our funded trader program and earn more with Scandinavian Capital Markets.
NZDUSD DAILY
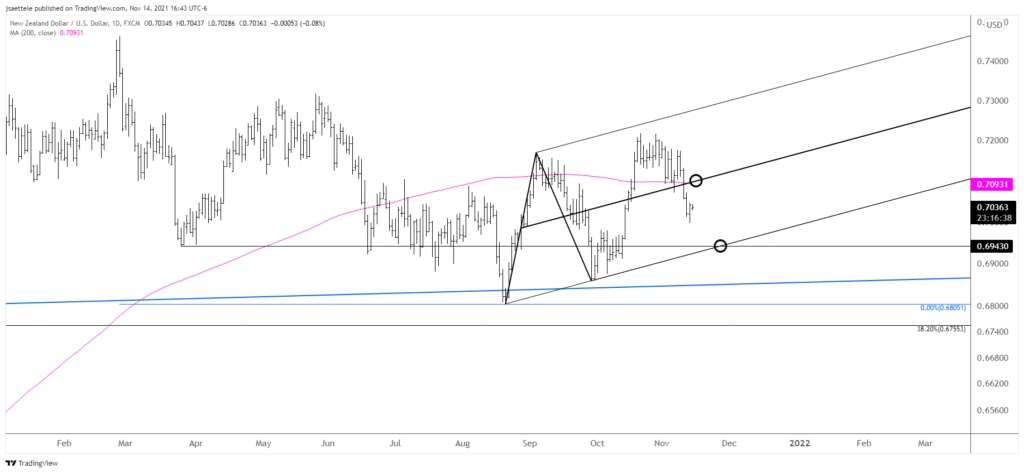
NZDUSD didn’t hold .7050 but there are well defined levels to pay attention to for near term support/resistance. The underside of the center line of the channel from the August low is near .7100. The 200 day average reinforces the level as possible resistance. Proposed support is the lower parallel and March low at .6943.
11/10 – If this USD rip is a big trap then NZDUSD will be the place to operate. The top side of former trendline resistance is about .7050. If we get a reaction (decent show of support) at this level, then I’ll be plotting long entries.
GBPJPY DAILY
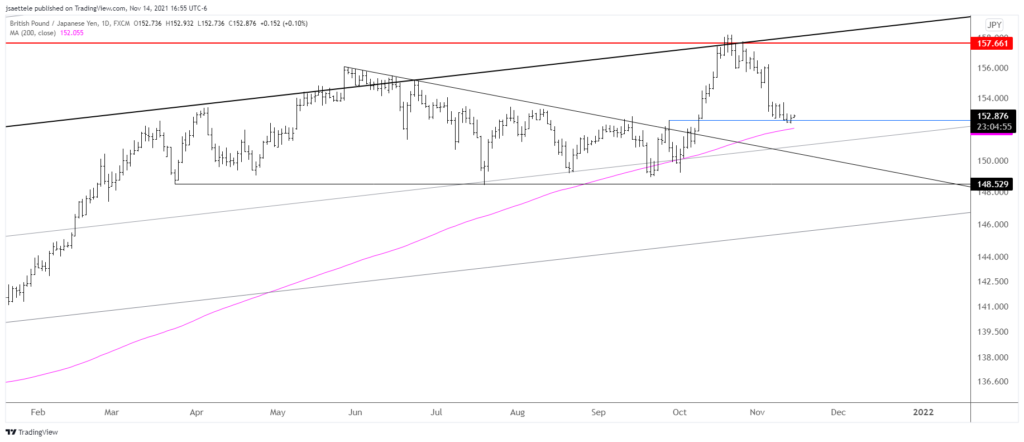
GBPJPY is interesting on the long side. Price has pulled back to test the 9/28 high (former resistance is now support). The 200 day average is just below as well and daily RSI has turned up from near 40 after registering ‘overbought’ readings at price highs in October (RSI is not shown). I am bullish but waiting for a clear entry.

