
Market Update 11/15 – AUDJPY Elliott Pattern
DXY DAILY
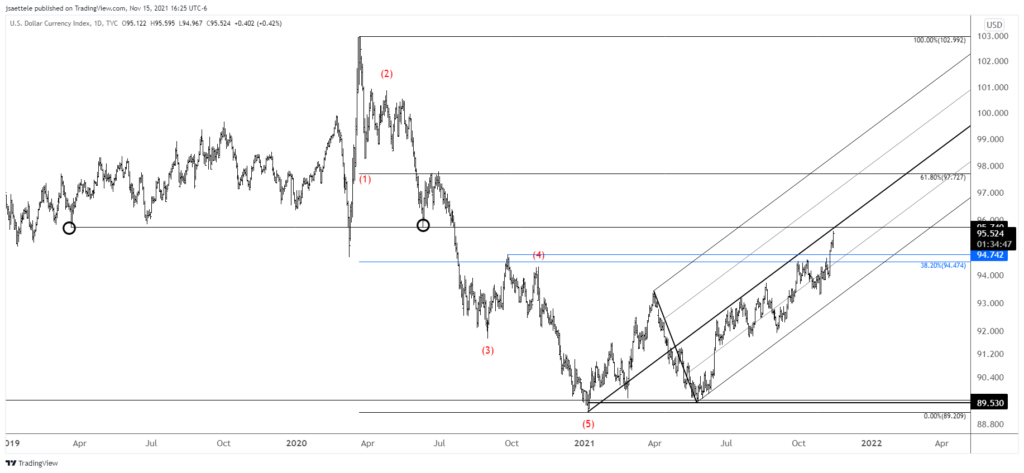
DXY is ticks from the median line of the structure that originates at the January low. If I were smarter then I would have stayed bullish the buck as long as price stayed within the structure. Lesson learned! That said, be aware of 95.70s for possible resistance. That’s the median line and June 2020 low.
AUDUSD 4 HOUR
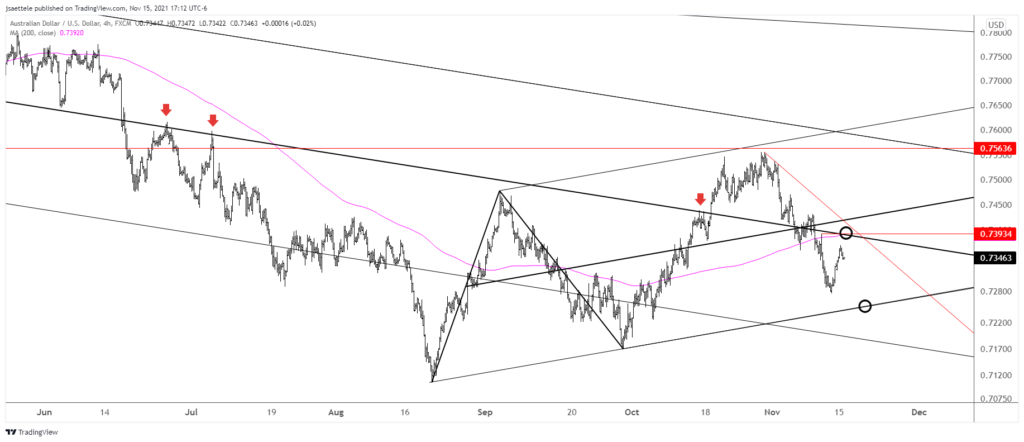
Zero in the.7390-.7400 for possible AUDUSD resistance. The level is defined by the center line of the channel that originates at the February high. This line was precise resistance in June, July, and October. It’s also the 11/10 high and 200 period average on the 4 hour chart. This average has been a useful near term pivot.
11/10 – I was looking for a bounce into .7480 before additional AUDUSD weakness. Instead, we got AUDUSD weakness without a bounce. From here, I suggest paying attention to .7400/20 for resistance and .7240 for possible support (bottom of channel).
Do you make a profit trading AUDUSD?
If you’re a consistently profitable trader, consider joining our funded trader program and earn more with Scandinavian Capital Markets.
EURJPY DAILY
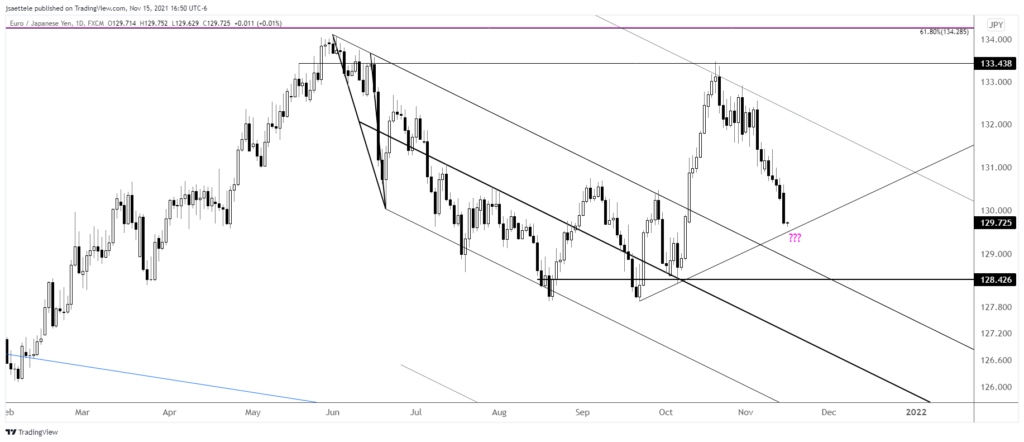
EURJPY has retraced the entire breakout move that began on 10/11 but watch for support near 129.50. This is the 10/6 high and line that extends off of the September and October lows.
AUDJPY DAILY
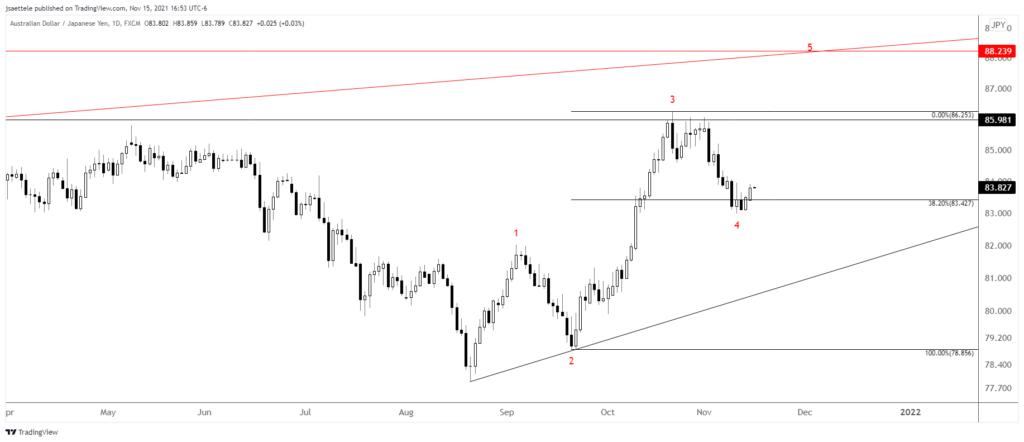
I’m of the mind that AUDJPY put in a 4th wave low last week. The decline from the October high retraced slightly more than 38.2%. I like that price reversed sharply higher 11/10 (day of the low). That day’s close is proposed support at 83.44. This is an example of daily reversal support. A 5th wave high is favored.


