Market Update – May 19
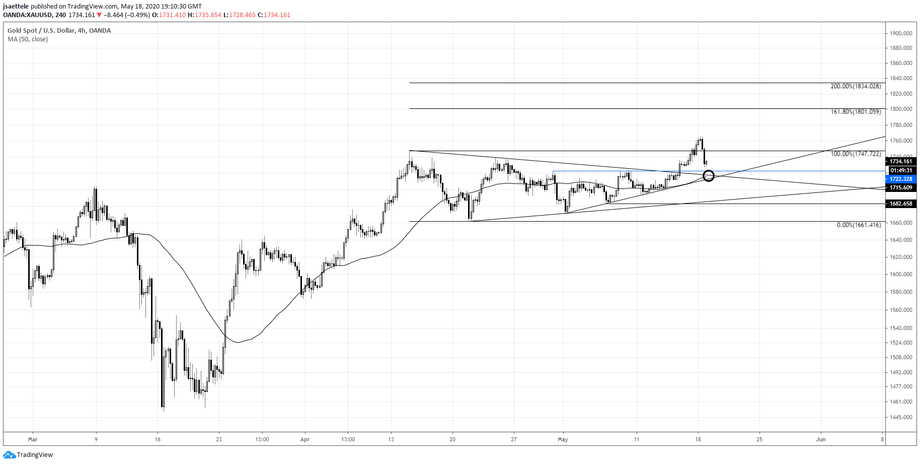
SPOT GOLD (XAUUSD) 4 HOUR
Gold is pulling back to the top side of former triangle resistance. If gold is bullish, then suppport should be 1716/22. I’m looking to buy in that zone for resumption of upside. If the noted zone fails to hold, then gold would turn extremely bearish because the recent breakout would be considered a completed terminal thrust from a triangle.
5/14 – The chart of spot gold is cleaner show I’m showing it instead of futures. Price broke out of the triangle described yesterday. That’s bullish! The top side of the former triangle line should be support now near 1720/22 (former highs at 1722).
USDNOK HOURLY

USDNOK has broken down from a head and shoulders continuation pattern. The target from this pattern is 9.43. Resistance should be former support at 10.1180. The setup is to short a test of that level with a stop above Friday’s high.
5/7 – USDNOK declined in 5 waves from the March high. Since the April low, we’ve seen an up leg and down leg. My thinking is that these are waves A and B of a flat, primarily because of oil’s reversal from the 2016 low today. If this plays out as I suspect, then there will be a tremendous short opportunity in USDNOK at 11.2160-11.3629. On a long term basis, a 12 year advance may have ended at the March high as per the 5 wave rally from the April 2008 low (see below).
USDOLLAR 4 HOUR

Given today’s decline, it’s possible that wave C of a flat ended last week in a truncated fashion. A truncation occurs when wave 5 or C fails to take out the price extreme of wave 3 or A. Pay attention to the short term lower trendline near 12500. That level is still possible support so a break would support the idea of that wave C completed as a truncation.
5/12 – Textbook action in USDOLLAR! The pullback found support from the 200 hour average and topside of the April trendline. My view is that wave 3 of C is underway towards 12700 or so. This should be a sharp advance.
EURUSD 4 HOUR

Be nimble…no ego…don’t be afraid to change your mind. Recent FX action, especially in EURUSD, drives home the importance of these trading ‘truths’. Action since the March low is still contracting but could be a consolidation bottom rather than a bearish triangle. Both interpretations are valid. 1.0955 (also the month open) is still possible triangle resistance but there is a short term ‘slingshot’ buy setup (buy into the blue line) into 1.0875, which is also former resistance. There is also a confirmed bullish channel from the March low because the median line was tagged and the lower parallel has held as support.
GBPUSD HOURLY

GBPUSD has turned up sharply so I must consider the possibility that the corrective decline from the April high is complete. Specifically, the decline is counted as W-X-Y decline because the subwaves are corrective. Near term, watch for resistance near 1.2280. If price trades to there and pulls back, then the center line will be watched for support near 1.2170.
USDCAD 4 HOUR

USDCAD traded into proposed support at 1.3950 today but is weak as a kitten and attempting to break. If price does break here then immediate focus would be on the median line of the Schiff fork near the 1.3855 lows. If reached, then trading focus would be on shorting a bounce into the underside of the blue line, which has been support throughout May. That would be about 1.3960/70.
5/14 – USDCAD failed at short term trendline resistance today. A high volume hour also printed at 1.4100. Watch that for resitance now. As long as price is under today’s high, near term focus is towards 1.3950 support, which is trendline support (blue line) and the month open.


