Market Update – August 17
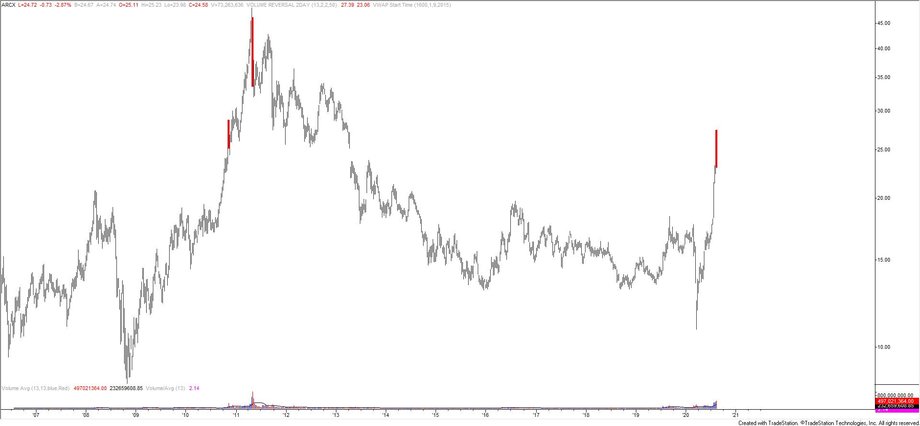
Silver made a 2 bar weekly volume reversal last week. Volume reversal logic is explained here. The only other signals with the same volume requirements occurred in December 2010 and April 2011. The former was not a top but the latter identified a major top. Near term, the rally from the 8/11 low has already retraced 61.8% of the preceding decline so a lower high may be in place.
8/6 – After some back and fill, silver blew through 26. The recent parabolic move could run into a ceiling near 33.80. This is based on a parallel related to the 1971-2001 trendline. This parallel crosses highs in 1974, 1987, and 2008.
SPOT GOLD HOURLY

High so far for gold futures is 2089.2….close enough to the 2095 measurement to think that an important top is in place. Near term, proposed resistance for spot is 1987-1994. Also, a strong of 9 consecutive up weeks ended last week. The only other time that has happened in GLD was May 2006 (see below). That led to a nearly 24% drop. The near term GLD wave count is especially clear (2 charts down). The decline is impulsive (5 waves) so expectations are that the rally proves corrective. Levels to keep in mind for resistance in GLD are 185.50ish (VWAP from the high) and 188.56 (61.8%).
8/5 – Expanding on yesterday’s gold chart (remember that the Fibonacci measurement is 2095…today’s high was 2070…), daily RSI is now 89.8. The indicator has been this high just twice before; January 1980 (twice) and September 1999. I’ve overlaid EURUSD for both periods. In 1999 (above), gold spiked higher after pulling back from the extreme RSI reading and eventually topped on October 5th. EURUSD didn’t top until October 15th but then dropped for the next year. In 1980, EURUSD topped on the exact day of the extreme RSI reading (January 7th…see below) and plunged for the next 5 years. Gold pulled back slightly before spiking into its high on January 21st. This says nothing of what will happen going forward with either gold or EURUSD. Rather, historical precedence does suggest that both are vulnerable to mean reversion and possibly much bigger trend reversals.
This is a gold analog I’ve been following since December 20th. The queried time series is in red. Since then, gold has followed the projected path fairly well. The next pivot in the analog is August 12th (next Wednesday). Worth following as long as this is ‘working’. A zoomed out full version is below. Let your mind get creative.
GLD WEEKLY

GLD HOURLY

U.S. DOLLAR INDEX FUTURES WEEKLY

DX futures made a 2 bar weekly volume reversal 2 weeks ago (inside week last week). Reversals on both sides with the same volume requirements are shown on this chart since the late 1980s. The majority of signals identified important turns. Also, add the recent BoA survey to the list of extreme sentiment examples (see below). Sentiment is ripe for a turn.
7/29 – This is an analog that we’ve been following for several years. The mirror image of DXY price action from the February 1991 low closely matches price action from the March 2015 high. Figure out ‘why’ if you want but it continues to ‘work’ and I’m intrigued because the analog suggests consolidation through year end before the USD takes a digger in 2021. A close-up view is below.
BETTING AGAINST THE DOLLAR IS MORE POPULAR THAN EVER, BOFA SAYS
Some highlights…
“This is the most bearish sentiment has been in our survey history, while positioning was last this underweight USD in 2008,” strategists Ralf Preusser and Myria Kyriacou, wrote in the report.
Bullish sentiment on the euro improved to record levels in the survey…
SWISS FRANC FUTURES WEEKLY

Swiss Franc futures also made a 2 bar weekly volume reversal 2 weeks ago (inside week last week). The only other such reversal with the same volume requirements was the week of the 2011 Swiss Franc high (USDCHF low). Just another piece of evidence that points to a USD turn.
EURUSD WEEKLY

EURUSD finished higher last week for the 8th consecutive week. That has happened twice since inception of the euro; January (9 up weeks) and December 2004. Both instances occurred near important highs. Again, add this to the list of things that tend to occur near important turns.
USDJPY DAILY

USDJPY turned down on Friday from the 25 line within the channel from the March high. This line was resistance in June and July. I’m thinking that support resides near the median line and daily reversal support (7/31 close) at 105.85. The next upside level of interest is the upper parallel and 200 day average at 108.10. I favor buying weakness near noted support.
8/4 – USDJPY has pulled back slightly following Friday’s big reversal. Focus for the next pivot is 105.05/30 (61.8% retrace and 7/30 high). The zone is reinforced by parallels within the channel from the March high. Notice the number of pivots at the parallels that are equidistant from the center line. This illustrates the concept of symmetry in median analysis that I often reference.
NZDUSD HOURLY

NZDUSD broke the channel from the March low and initial downside focus is the former 4th wave low at .6380. Price is sitting on the lower parallel from the short term bearish channel. If price breaks below, then the underside of that line becomes resistance. If price bounces here, then .6585-.6600 is proposed resistance.
8/3 – NZDUSD held channel support from the March low today but note that Friday’s reversal occurred from the line off of the July 2019 and December highs. The high volume level from Friday is .6660 and 61.8% of the decline from Friday’s high is .6662…that is now proposed resistance (see hourly chart below). The daily chart below highlights what I call an ‘angle of influence’. Parallels from the line off of the 2017 and 2018 highs cross a number of major pivots, including Friday’s high. The chart of daily futures (also below) shows VWAPs that could eventually provide important support. VWAP from the March low and 2020 VWAP currently cluster near .6300.
USDCAD 4 HOUR

USDCAD turned up last week after taking out the 2/21 low at 1.3202. I favor going with strength above 1.3315. If that happens, then initial upside focus is the June high at 1.3715.
8/5 – USDCAD is testing the top side of the line off of the 2018 and 2019 highs. This line was support in June. The trendline from the 2017 low, 200 week average, and February low are just below at 1.3170-1.3200. I’m focused on that zone for a low.


