Market Update 7/15 – Bullish Euro/Commodity FX
NASDAQ FUTURES (NQ) DAILY
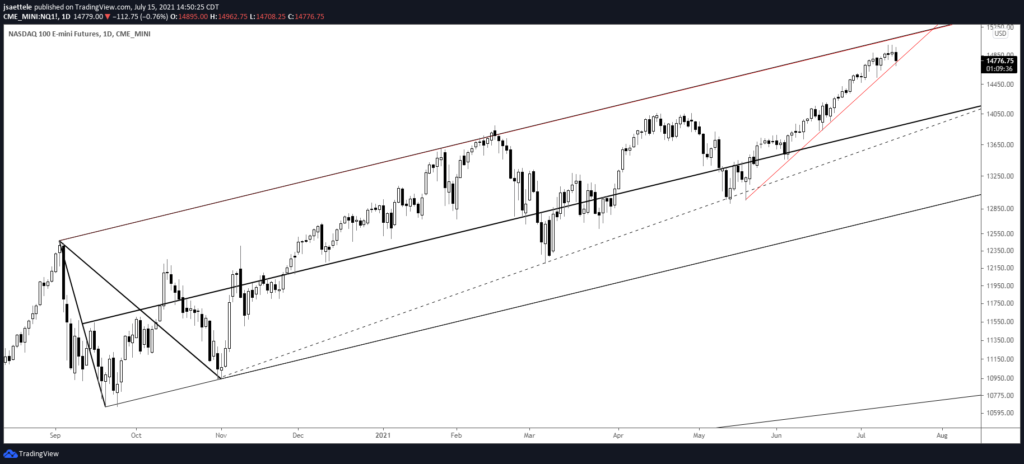
Nothing to add regarding NQ. Just be aware that price closed right at the short term trendline today. I’d love to see a tag and reversal off of that upper channel line near 15100 but if price breaks tomorrow then it’s ‘proper’ to operate from the short side.
7/12 – Apologies in advance for noting possible resistance in NQ. The number to know is roughly 15060, which is defined by the upper parallel from the channel that originates from the September low. On an extremely long term basis, know that the trailing 4Q PE for the S&P 500 (see below) just reached a record. The prior record was in June 1999.
EURUSD HOURLY
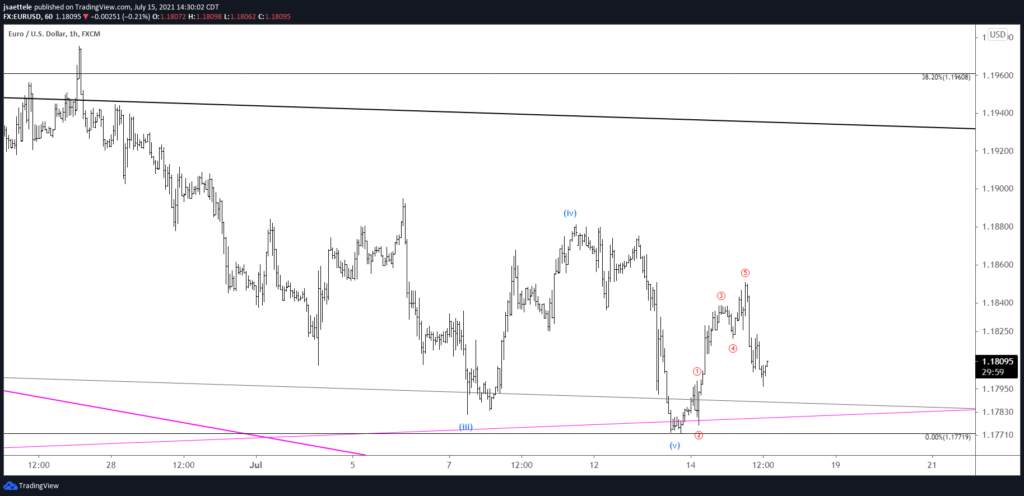
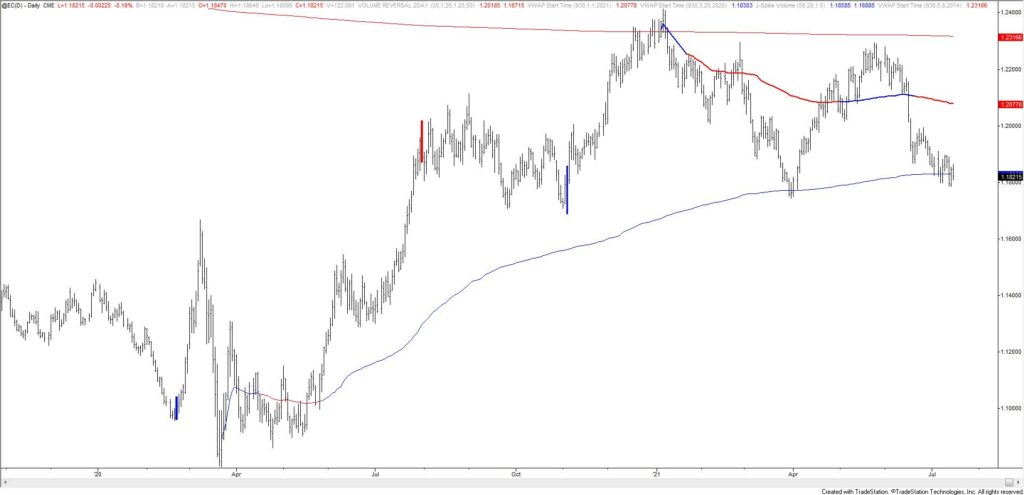
DXY and USDOLLAR remain in flux (one more push higher as per the 4th wave interpretation?…see yesterday’s post) but EURUSD action from the low is constructive. Price rallied in 5 waves and declined in 3 waves therefore I lean towards the long side against 1.1772. Also, don’t forget that Euro futures are holding VWAP from the March low (see below).
7/14 – Despite USDOLLAR and DXY comments, I’m of the mind that EURUSD put in a low today. The drop from 5/25 ‘counts’ in 5 waves and the level is extremely well-defined (trendline from November low). The high volume level from US CPI at 1.1800 is proposed support. Upside levels of interest are 1.1940/75 (median line and 6/25 high) and 1.2078 (61.8% retrace and 75 line…the low is on the 25 line so watch for that symmetry!).
EURO FUTURES DAILY
USDJPY 4 HOUR
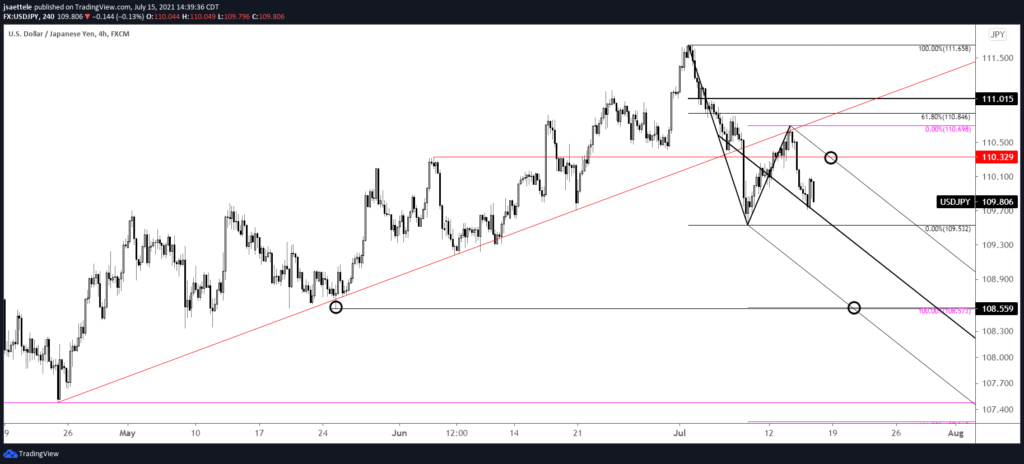
still favor shorting USDJPY into 110.30/40. In fact, a short term channel has been confirmed with the tag of the center line today. The upper parallel is in line with proposed resistance.
7/14 – USDJPY reversed just before the noted zone but on the underside of former trendline support so I’ll adopt a bearish view against today’s high. Proposed resistance is 110.30/40. The target on this swing is 108.50s as 2 equal legs down from the high is 108.57 and the 5/25 low is 108.56.
USDCAD 4 HOUR
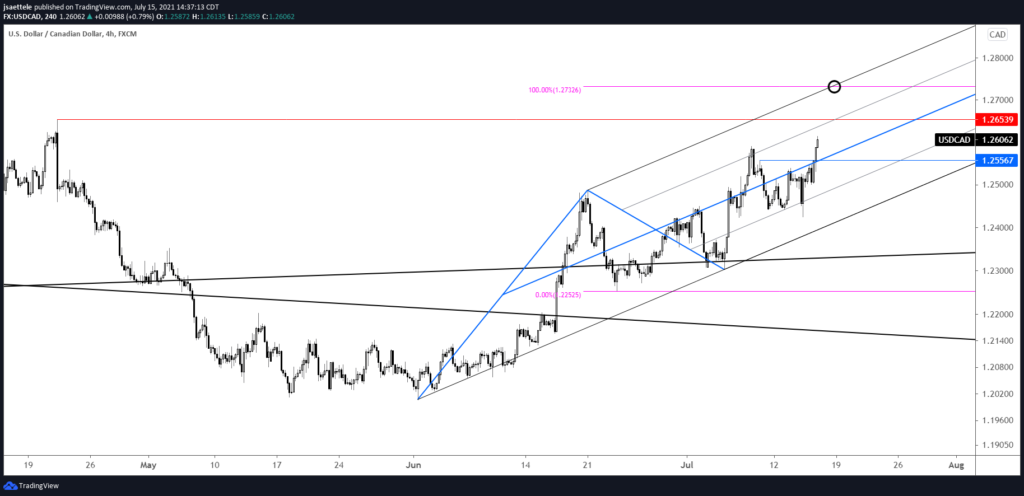
The initial BoC reaction was wrong. Price spike lower and immediately reversed. After all that, nothing has changed. Upside focus remains 1.2650 and 1.2720/30. Support should be about 1.2560 now. This is the center line of the channel from the low. This center line has been resistance and support for most of July.
7/13 – BoC is also on Wednesday. This USDCAD chart is a perfect example of median line symmetry. The 75 was resistance and the 25 line was support! Price is testing the median line now. I’m bullish heading into the event with risk under today’s low. 1.2650-1.2730 remains a target/resistance zone. The upper parallel from the channel is about 1.2695. 1.2482 (high volume level) is now proposed support.
EURAUD 4 HOUR
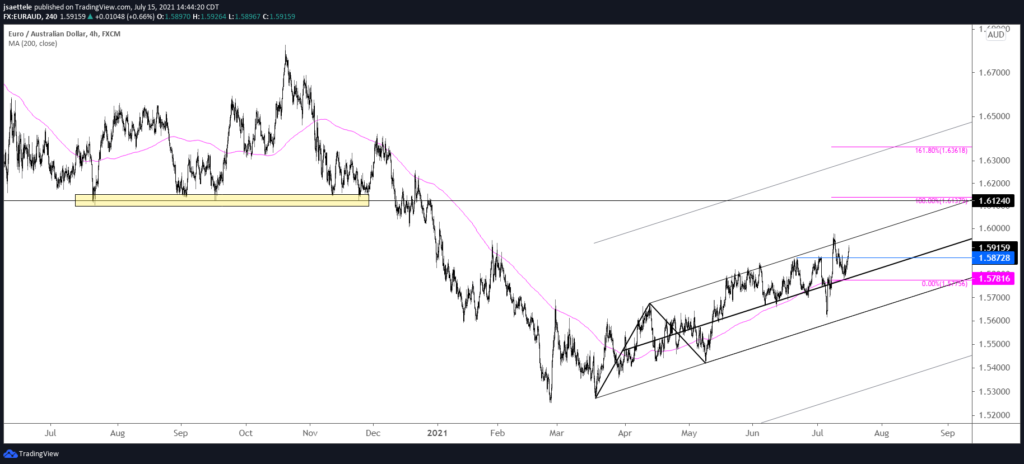
EURAUD has traded in a rather tight channel since March. Notice how priced turned up this week from the center line following a poke above the upper parallel. This is called a ‘raised floor’. The implication is that price is about to explode higher. A break above the upper parallel would trigger a slingshot setup in which the upper parallel would become support on a pullback. I don’t mind getting in front of this possibility. Former resistance at 1.5873 is proposed support now. Initial upside focus is 1.6120/40.


