
Market Update 5/11 – Yen Crosses Breaking Down?
DIA DAILY
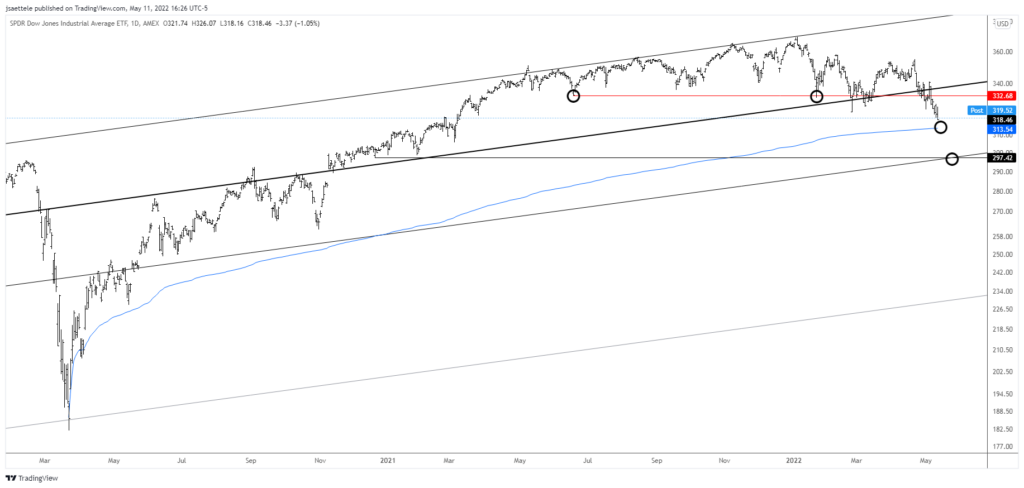
No change to DIA other than reminding that 313.50 is perhaps 1 day away. The ‘trend’ is lower and the channel low near 297.50 is more important but bear market rallies are sharp and one could occur from near 313.50. 332.70 or so remains key resistance if reached.
5/9 – DIA (Dow ETF) levels are extremely well-defined. A massive top is completed and the biggest level on this chart is 297.50 (or so). A drop to that level would represent a 20% drop from the all-time high. In the grand scheme of things, that’s fairly normal. Possible trading levels before then include 313.50 (VWAP from the March 2020 low) and 332.70 for resistance (former support). The full view of the structure from the 2020 low is shown below.
U.S. T BOND FUTURES WEEKLY
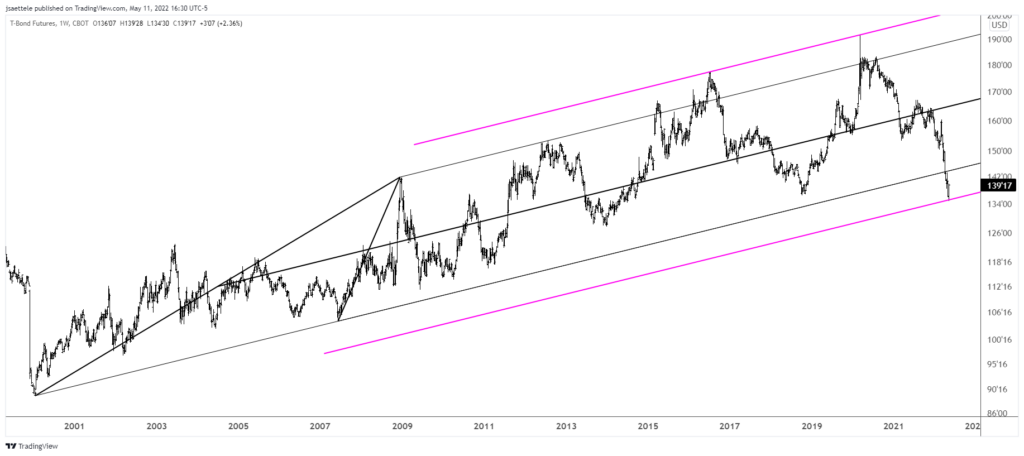
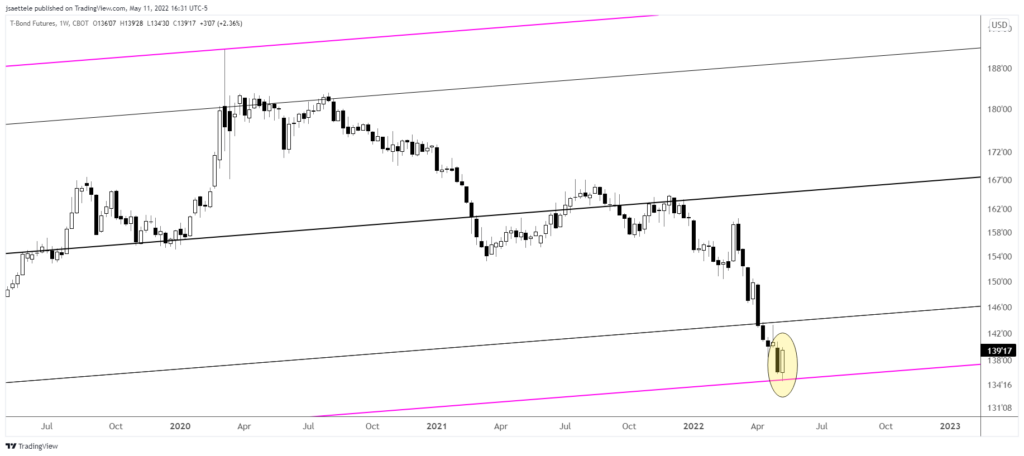
We looked at the 30 year yield 2 days ago so why not take a look at bond futures after the long bond yield has dropped. Amazingly, bond futures reversed right at the parallel symmetrical to the median line that nailed the March 2020 COVID high. What this means is that the parallel on this week’s low is equidistant to the parallel that tagged the March 2020 high. This is a perfect example of median line symmetry and reinforced the bullish bonds ‘call’. Bonds are working on a weekly reversal (close up chart is below) as well.
5/9 – The 30 year U.S. yield traded 3.309% today before fading back. Today’s high was right at the 28 year trendline (to the tick). We did get a key reversal on TLT but volume was just slightly above average. In any case, one has to start thinking about long bonds here (yields declining) and consider the potential that the next market phase is traditional risk-off (bonds up, stocks down, Yen up, etc).
U.S. T BOND FUTURES WEEKLY
USDJPY 4 HOUR
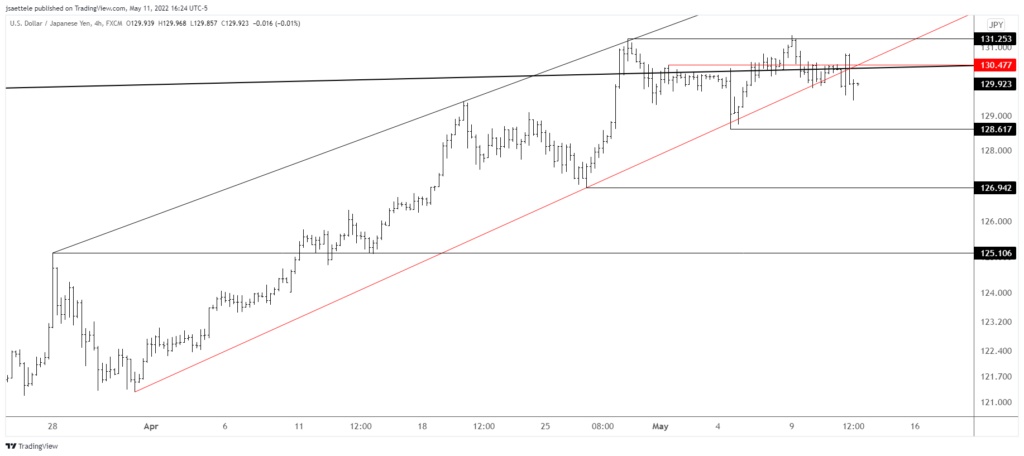
USDJPY has broken the trendline from the late March low. I’m bearish. 130.40/50 is now proposed resistance.
5/9 – The line off of lows in March and April for USDJPY is the breakdown level. This line was support after FOMC last week so consider the line ‘verified’. A drop below opens up a possible double top with recent highs and finally the potential for a much needed counter trend move. Also, the possibility of a ceiling (at least for a while) in yields adds to the USDJPY short intrigue. Bond yield and USDJPY is below.
Trade on mobile with cTrader
cTrader is one of the world’s leading trading platforms, with versions available in web, desktop, iOS, and android.
Learn more
AUDJPY DAILY
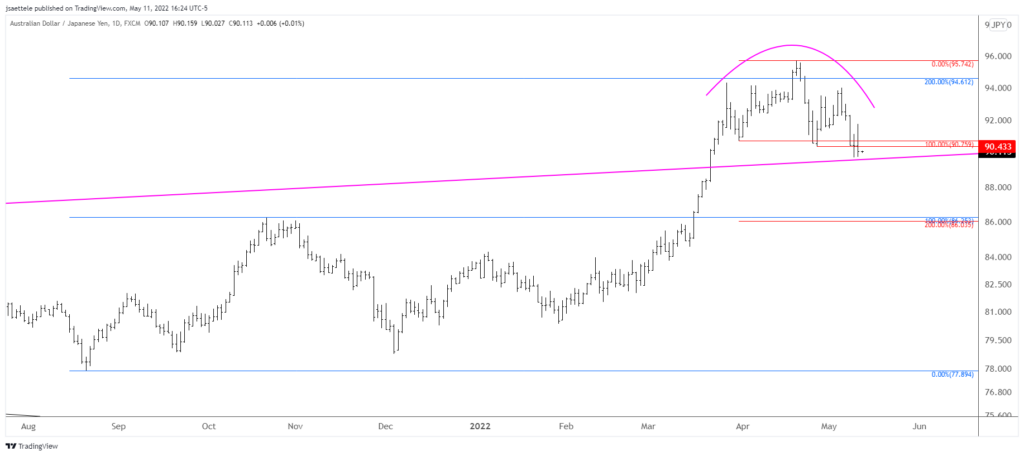
AUDJPY has completed a 7 week head and shoulders top. The measured objective from the pattern is 86, which is in line with the October high.
5/9 – AUDJPY is pressing the neckline from a nearly 2 month topping pattern. The objective from the pattern is 86. A possible near term path is outlined in which price resumes lower in order to test a short term median line before a bounce materializes. The short opportunity would be on that bounce with resistance near 90.75.


