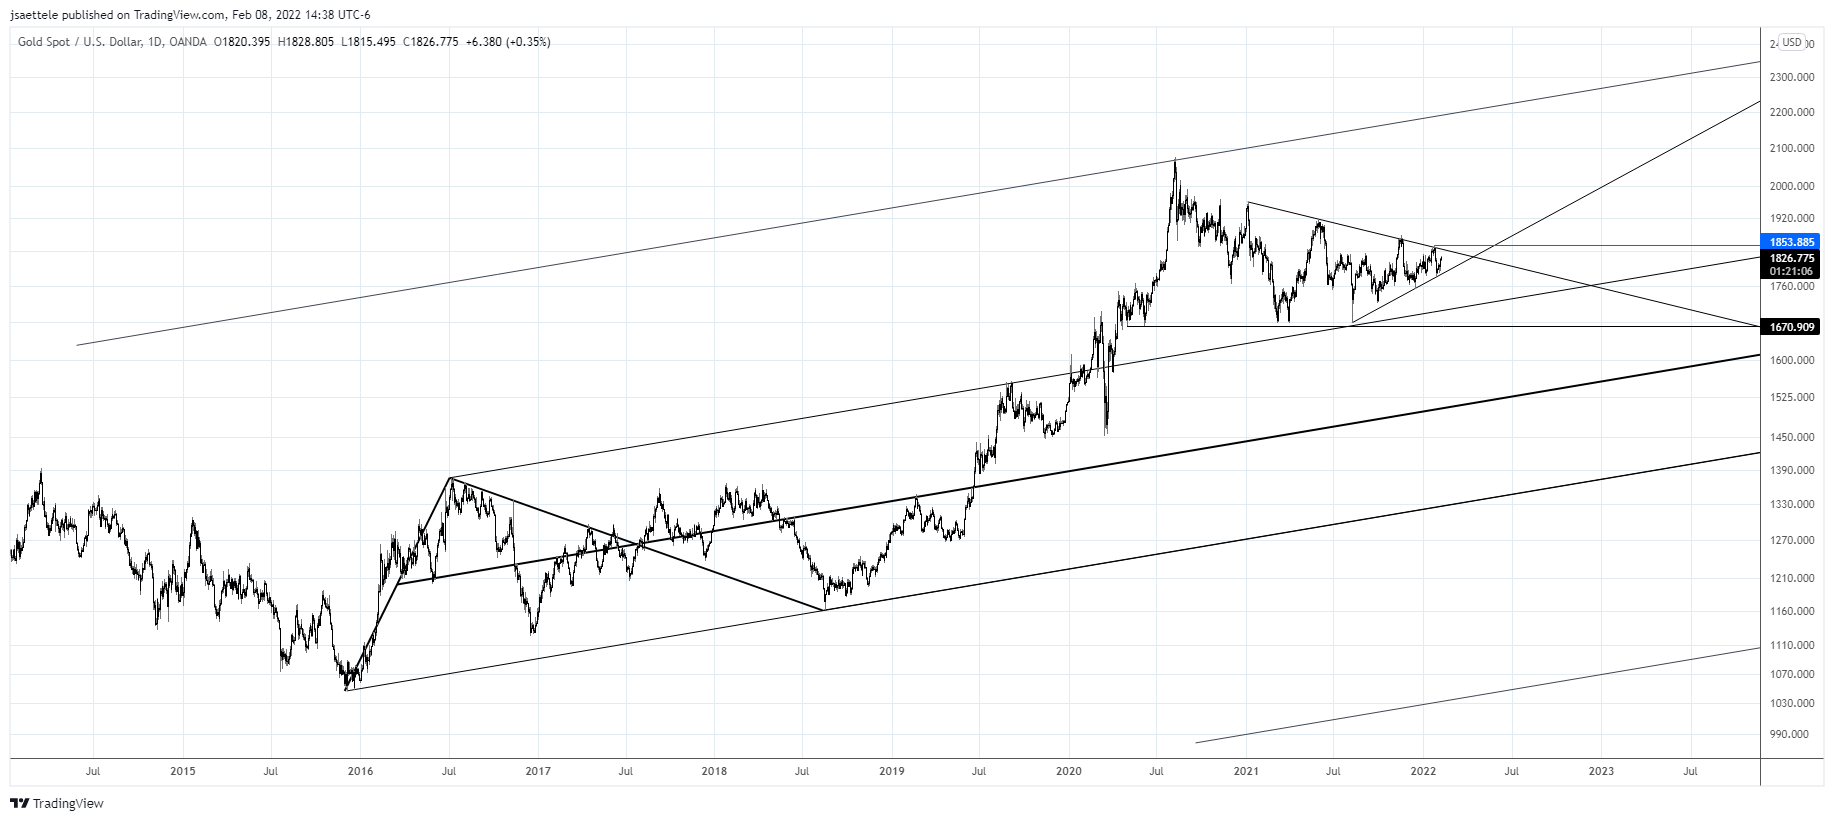
Market Update 2/8 – Watch Gold Up Here!
ETHUSD 4 HOUR
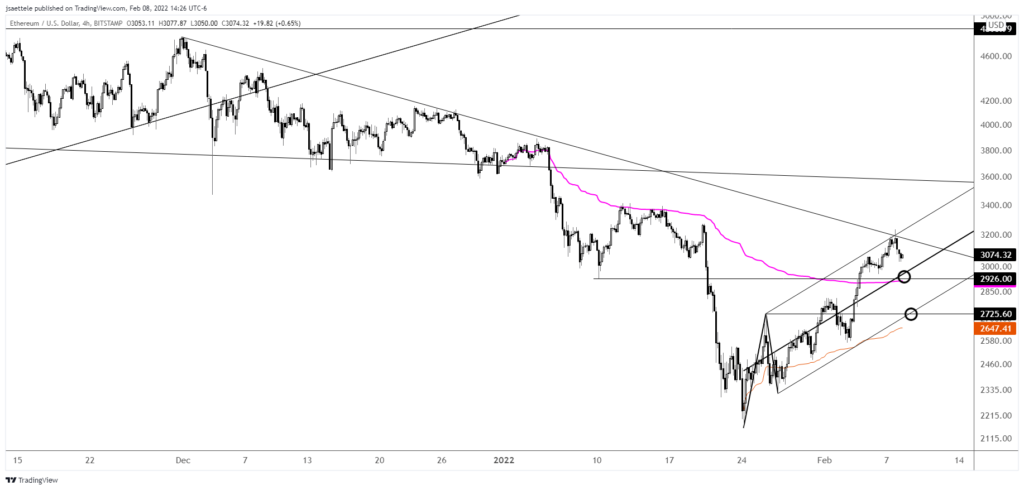
ETHUSD has traded into (and slightly above) the proposed resistance zone. Still, price did respond to a negative trendline so it makes sense to think lower at the moment. Watch for support near 2926 and 2725. The latter level is more important. Proposed resistance is 3155.
2/1 – ETHUSD is approaching a possible resistance zone. The bottom of the zone is defined by the 1/10 low and 2022 VWAP at 2926. The top of the zone is the underside of the line that connects lows in November and December. That is about 3140. VWAP from the May 2021 high is in the middle of the zone at 3040. This average has been key resistance and support over the last 7 months.
SPOT GOLD DAILY
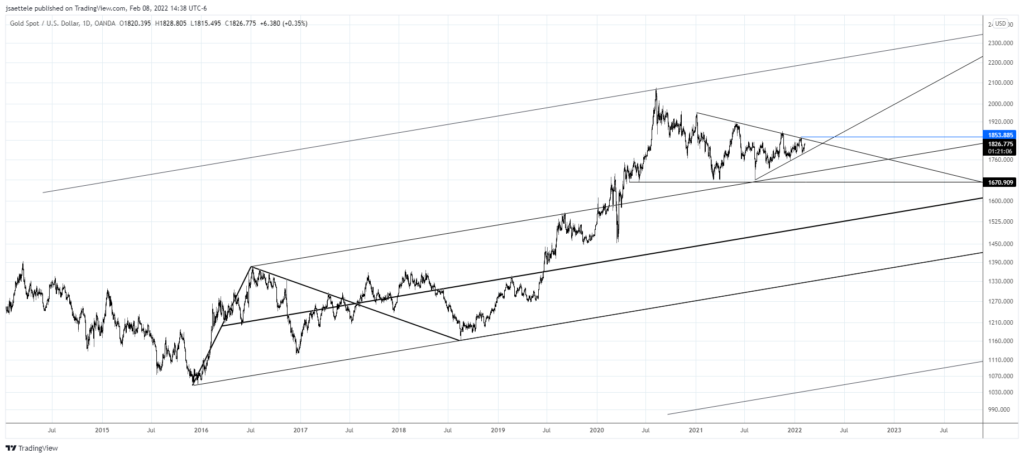
I’ve been focusing on near term gold levels recently, which have played out well. 1815 was support today for example. However, don’t forget the big picture! Gold has been ‘coiling’ for over a year and is just under the trendline that originates at the January 2021 high. A break above this line would suggest at least a test of the 2020 high. Finally, notice the perfect channel re-test (channel from 2015 low).
2/7 – Gold has recovered and has reached the bottom of the proposed resistance zone. As a reminder, the 61.8% retrace is 1826 and the well-defined horizontal is 1830. If gold is building energy for a larger advance then 1814/15 should provide support.
GBPUSD HOURLY
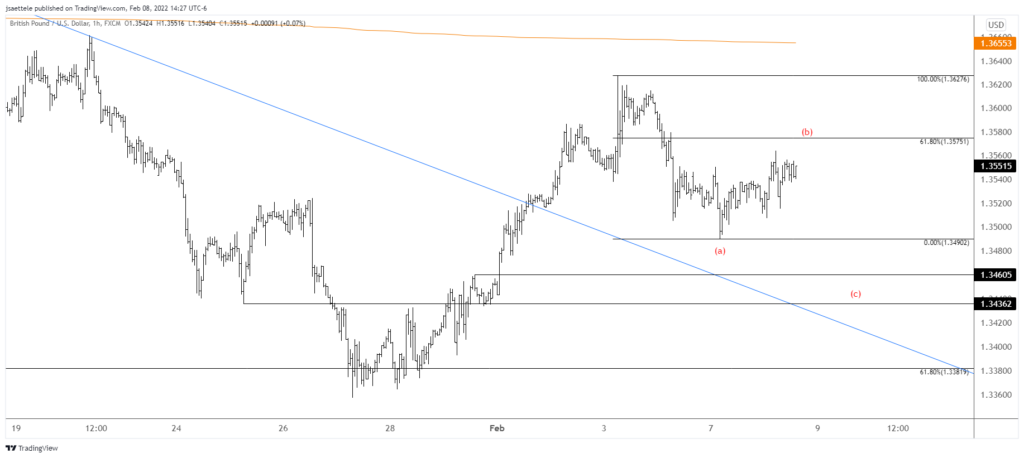
Cable sports 5 waves down from last week’s high. As such, I’m treating the recovery as corrective (b wave). Watch for resistance near 1.3575. 1.3436/60 is proposed support.
2/7 – GBPUSD has indeed pulled back and the drop from last week’s high is in 5 waves. As such, watch for resistance near 1.3575 (61.8% of the 5 wave drop). A level to keep in mind for possible support is the 61.8% retrace of the rally from the December low at 1.3460.
AUDJPY DAILY
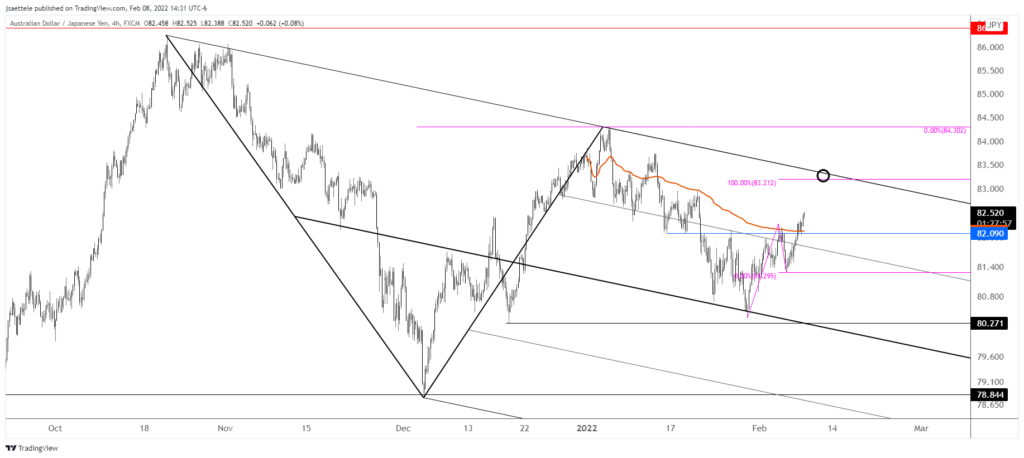
AUDJPY low at the end of January was right at the center line of the channel from the October high. The suggestion is that price trades up to the upper parallel (at least). That line intersects 2 equal legs up from the January low at 83.21. Watch for support near 82.10.

